***
title: Explore your services
approved: 2026-03-31T00:00:00.000Z
topictype: reference
max-toc-depth: 2
----------------
Get comprehensive insights into your API ecosystem with real-time analytics, health monitoring, and AI-powered assistance. Track performance metrics, monitor CI/CD pipelines, analyze service dependencies, and maintain spec quality, all from a unified dashboard.
Go to the **API Catalog > Integrated services**, and click a project to view the details. You can search for a specific API using names, tags, governance groups, or system environments. You can also sort the list of APIs by the following metrics:
* **Spec conformance** — The specification lint conformance status based on the governance rules.
* **Last CI status** — The last CI pipeline run status.
* **Error rate** — The percentage of requests resulting in 4xx or 5xx errors captured by the Insights Agent.
* **p95 latency** — The 95th percentile response time captured by the Insights Agent.
* **Last monitor run** — The last monitor run status.
* **Owner** — The API owner, based on workspace data.
## Analyze your APIs
Dig deeper into your API projects with specialized views for health metrics, governance compliance, CI/CD performance, and service dependencies. Monitor real-time endpoint performance, track specification conformance against governance rules, review pipeline activity, and visualize service interactions through dependency graphs. Each view provides actionable insights to identify issues, optimize performance, and maintain API quality across your development lifecycle.
## Explore project health and dependencies
When you select your project, you can check the health, API dependencies, and recent pull requests in your project. The dependencies require that you [install the Insights Agent](/docs/api-catalog/connect/insights/). The API Catalog then automatically discovers dependencies between your APIs based on traffic data from the Postman Insights Agent. You can also view the service graph to see how your APIs are connected to each other and identify any potential issues.
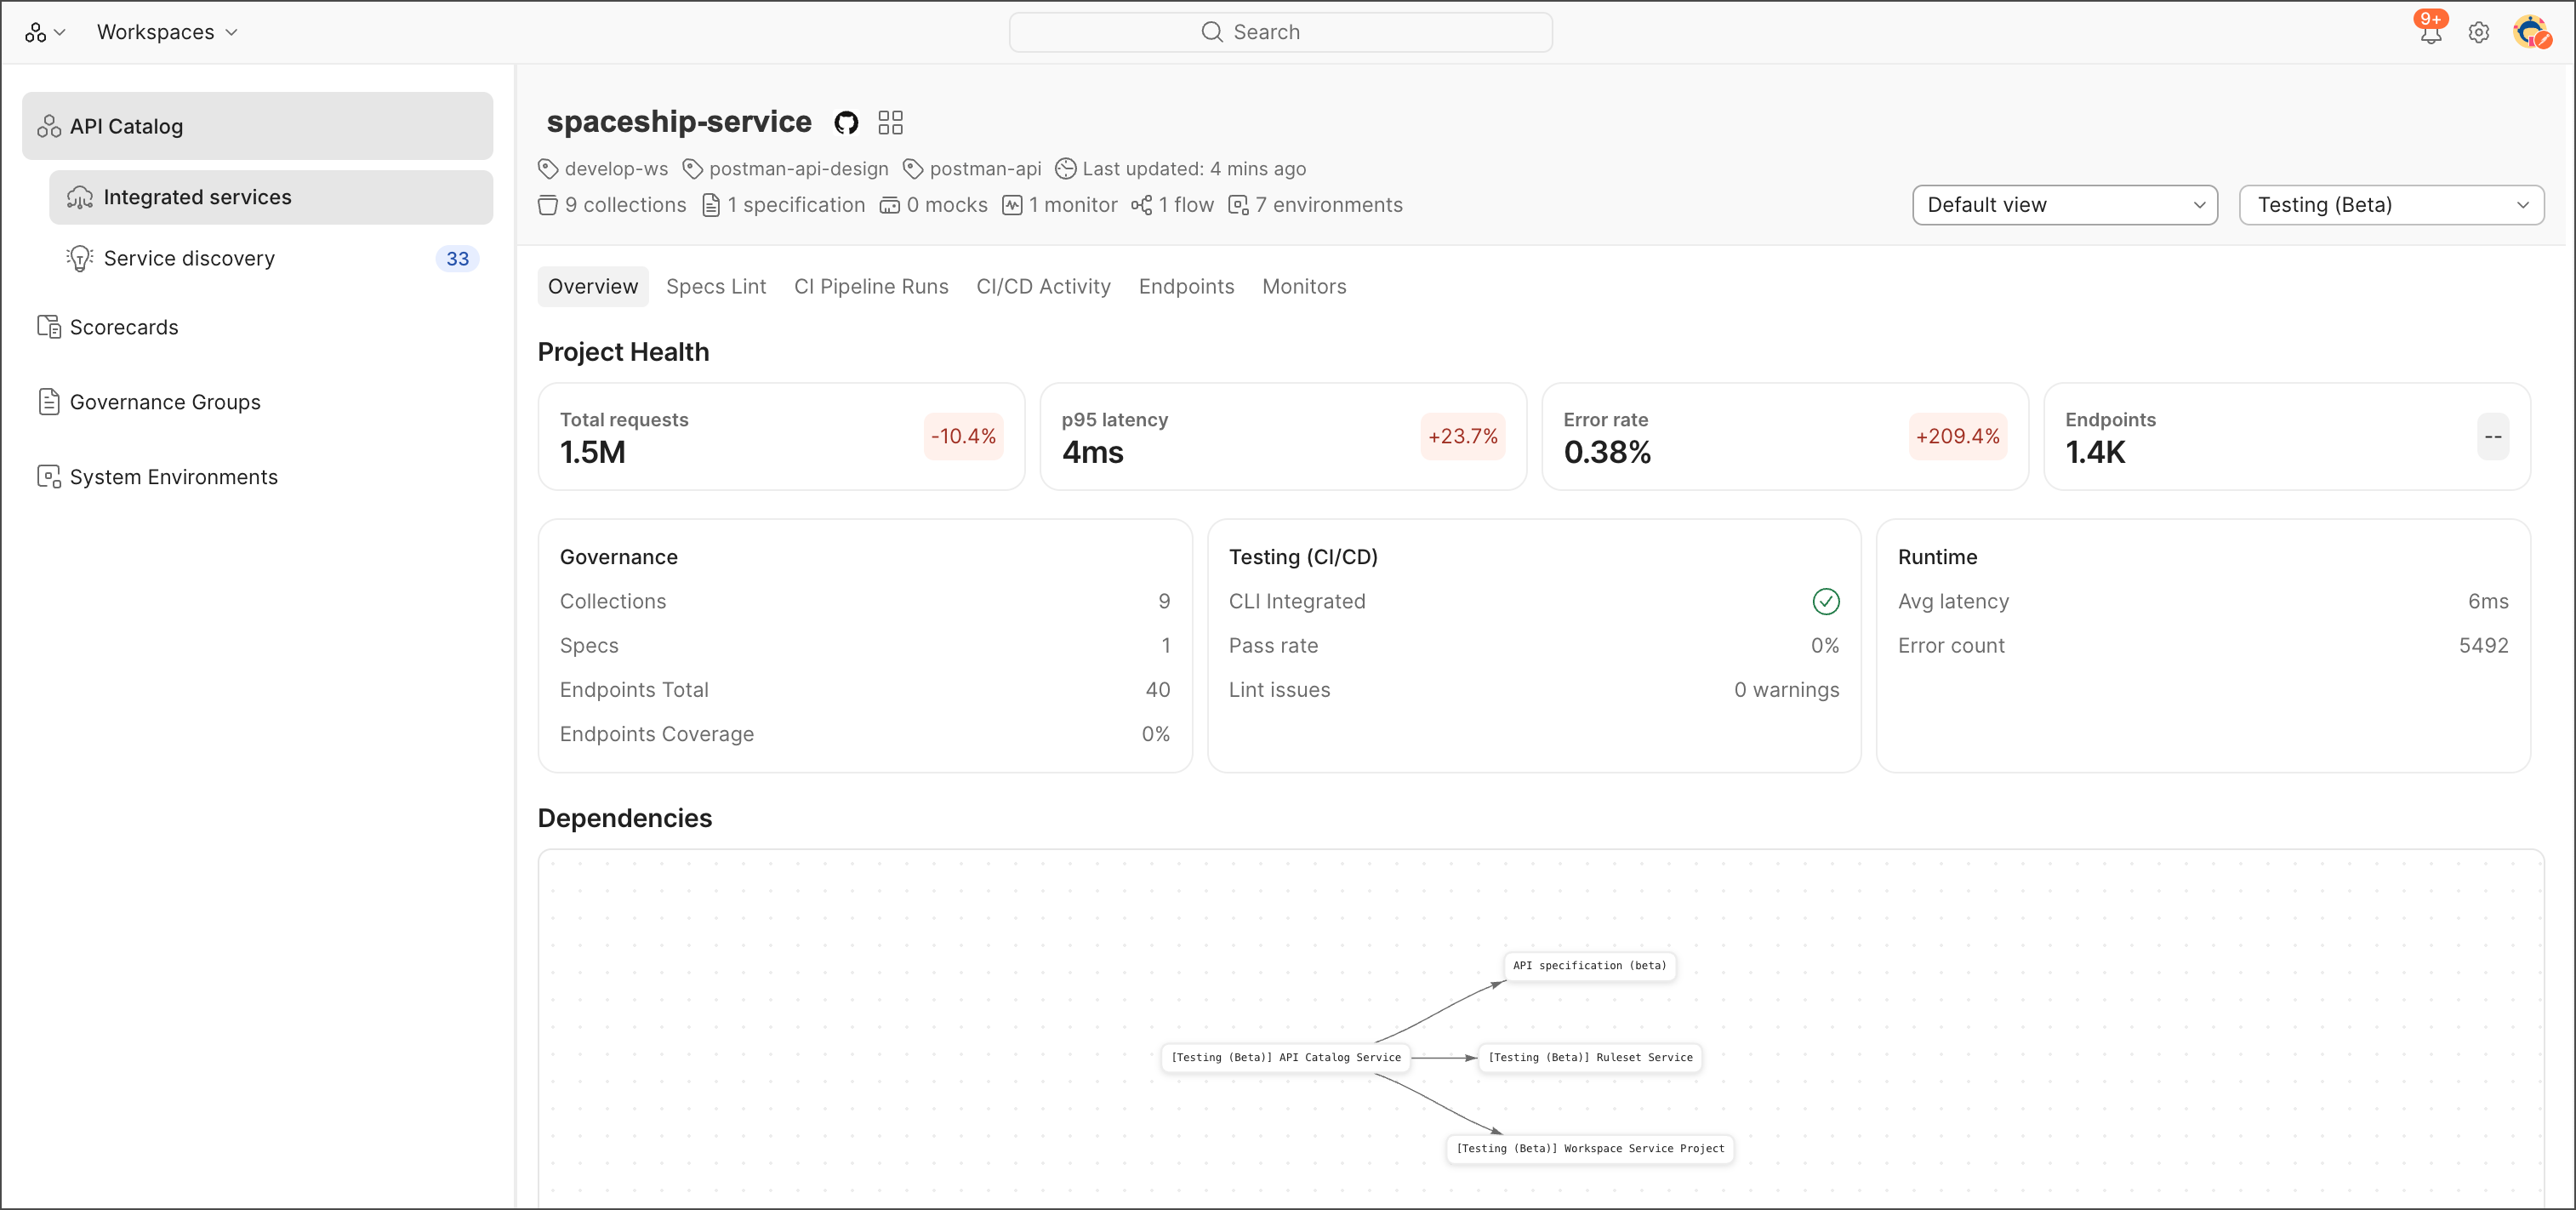 ### Check your project health metrics
Your project health metrics include:
* **Total requests** — API requests observed by the Insights Agent and percentage compared to the last seven days.
* **p95 latency** — The 95th percentile response time across all endpoints and percentage compared to the last seven days.
* **Error rates** — The percentage of requests that resulted in errors (4xx/5xx) and percentage compared to the last seven days.
* **Endpoints** — The total number of endpoints observed by the Insights Agent and percentage compared to the last seven days.
You can also check the following statistics about your project:
* **Governance** — The number of collections, specifications, total endpoints, and endpoint coverage percentage.
* **Testing (CI/CD)** — The CLI integration check, pass rate, and linting results.
* **Runtime** — The average latency and error count.
### Understand your service dependencies
The service graph within the API catalog provides a visual representation of how different services interact with one another. This dependency mapping is crucial for understanding service dependencies and the overall architecture. The service graph provides a trace of service interactions to help you quickly identify key infrastructure components and root causes of issues.
The service graph is generated based on traffic data collected by the Postman Insights Agent. To see the service graph, you need to have the Insights Agent installed and running in your environment. For more information on how to set up the Insights Agent, see [Postman Insights](/docs/api-catalog/connect/insights/).
### Check your project health metrics
Your project health metrics include:
* **Total requests** — API requests observed by the Insights Agent and percentage compared to the last seven days.
* **p95 latency** — The 95th percentile response time across all endpoints and percentage compared to the last seven days.
* **Error rates** — The percentage of requests that resulted in errors (4xx/5xx) and percentage compared to the last seven days.
* **Endpoints** — The total number of endpoints observed by the Insights Agent and percentage compared to the last seven days.
You can also check the following statistics about your project:
* **Governance** — The number of collections, specifications, total endpoints, and endpoint coverage percentage.
* **Testing (CI/CD)** — The CLI integration check, pass rate, and linting results.
* **Runtime** — The average latency and error count.
### Understand your service dependencies
The service graph within the API catalog provides a visual representation of how different services interact with one another. This dependency mapping is crucial for understanding service dependencies and the overall architecture. The service graph provides a trace of service interactions to help you quickly identify key infrastructure components and root causes of issues.
The service graph is generated based on traffic data collected by the Postman Insights Agent. To see the service graph, you need to have the Insights Agent installed and running in your environment. For more information on how to set up the Insights Agent, see [Postman Insights](/docs/api-catalog/connect/insights/).
 You can explore the following data points in the service graph:
* **Requests** — The volume of requests flowing between connected services.
* **Error rates** — The frequency of errors occurring in service interactions.
* **Latency** — The delay experienced when services communicate.
## Check recent pull requests
The API Catalog aggregates pull requests from different contributors. Access the PRs directly from the catalog to stay updated on the latest changes. You can see who submitted each PR, the status of the PR, and when it was submitted.
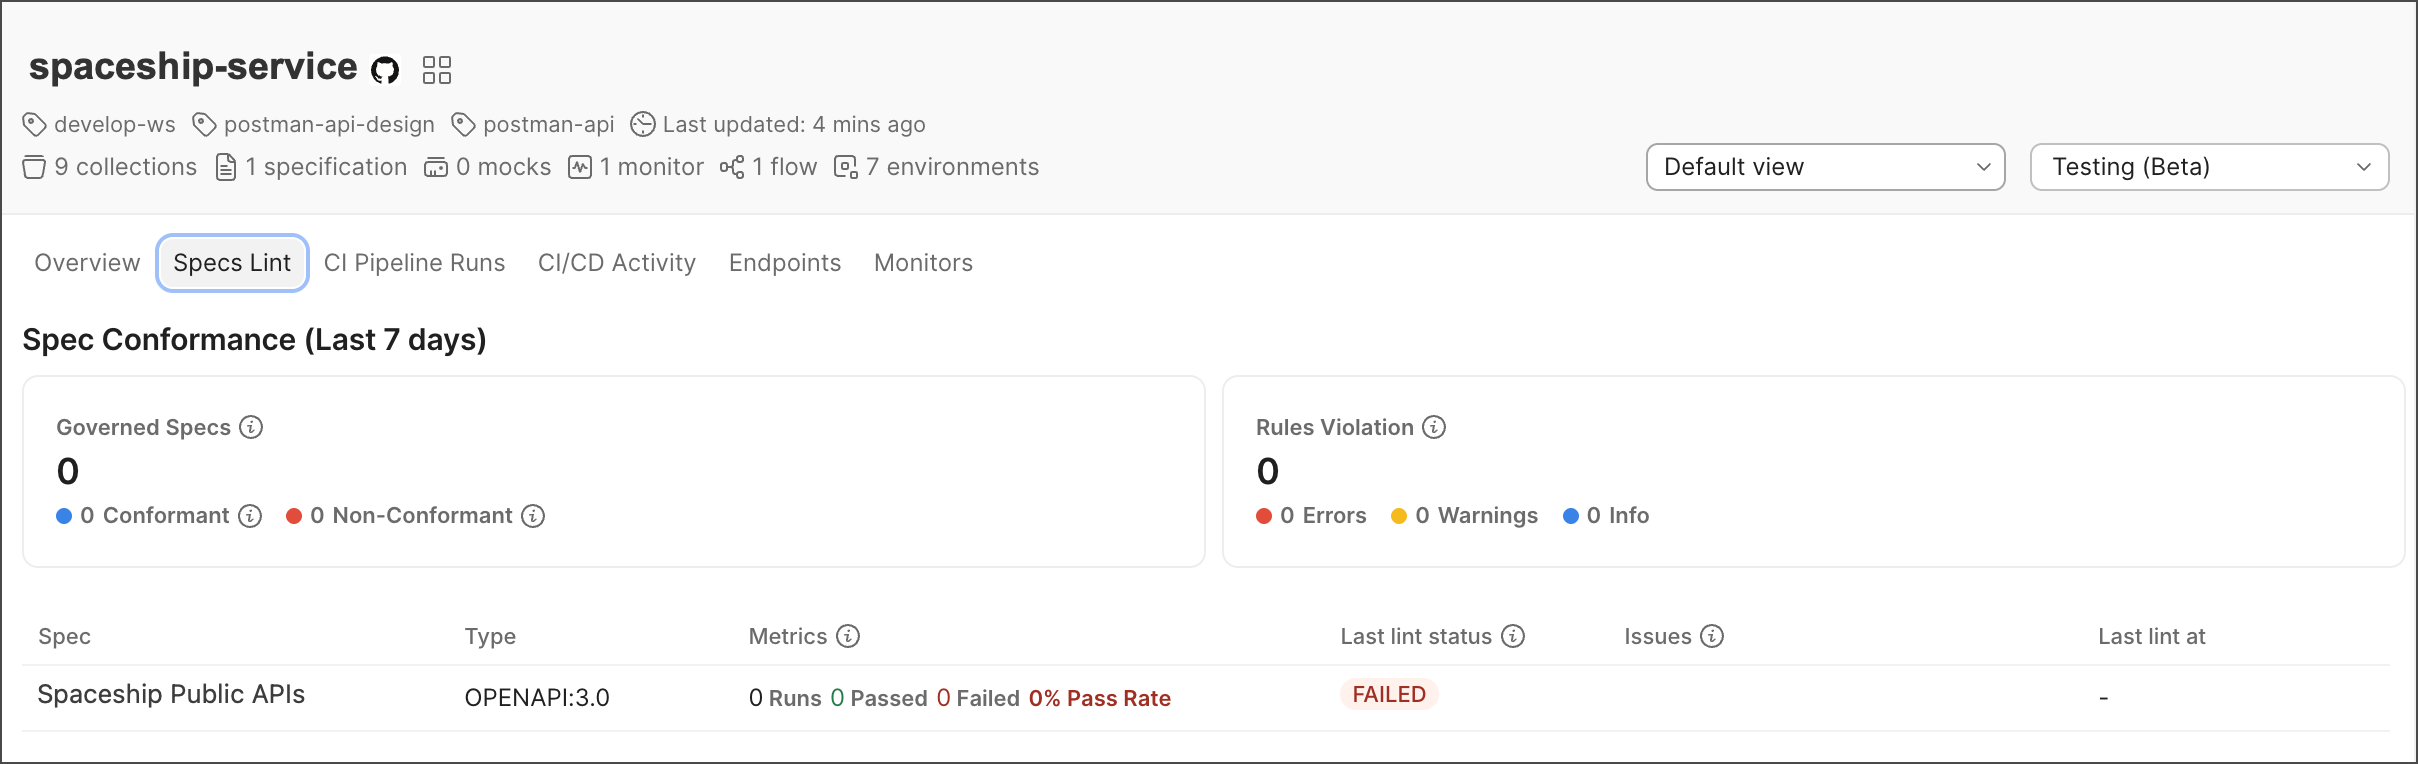
## Check your API specification conformance
The API Catalog provides a **Specs Lint** view that shows the conformance of your API specifications over the last seven days, based on the [governance rules you've set up](/docs/api-governance/configurable-rules/configuring-api-governance-rules).
You can explore the following data points in the service graph:
* **Requests** — The volume of requests flowing between connected services.
* **Error rates** — The frequency of errors occurring in service interactions.
* **Latency** — The delay experienced when services communicate.
## Check recent pull requests
The API Catalog aggregates pull requests from different contributors. Access the PRs directly from the catalog to stay updated on the latest changes. You can see who submitted each PR, the status of the PR, and when it was submitted.
## Check your API specification conformance
The API Catalog provides a **Specs Lint** view that shows the conformance of your API specifications over the last seven days, based on the [governance rules you've set up](/docs/api-governance/configurable-rules/configuring-api-governance-rules).
 You can check the following metrics in the **Specs Lint** view:
* **Governed Specs** — The total API specifications linted in the selected time range. Includes the number of governed specs with info or no violations, and the number of non-conformant specs with violations.
* **Rules Violation** — The total rules violations across all severity levels. Includes the number of errors, warnings, and info violations.
Each API specification in the list shows the name of the specification, its type, metrics (pass rate and total lint runs), last lint status, issues (count of warnings, errors, and info violations), and last lint time.
## Monitor your CI pipeline runs
The API Catalog provides a **CI Pipeline Runs** view that shows the status of your CI pipeline runs over the last seven days for your APIs. You can integrate with GitHub Actions, GitLab CI, and Jenkins to see your pipeline runs in the API Catalog.
You can check the following metrics in the **Specs Lint** view:
* **Governed Specs** — The total API specifications linted in the selected time range. Includes the number of governed specs with info or no violations, and the number of non-conformant specs with violations.
* **Rules Violation** — The total rules violations across all severity levels. Includes the number of errors, warnings, and info violations.
Each API specification in the list shows the name of the specification, its type, metrics (pass rate and total lint runs), last lint status, issues (count of warnings, errors, and info violations), and last lint time.
## Monitor your CI pipeline runs
The API Catalog provides a **CI Pipeline Runs** view that shows the status of your CI pipeline runs over the last seven days for your APIs. You can integrate with GitHub Actions, GitLab CI, and Jenkins to see your pipeline runs in the API Catalog.
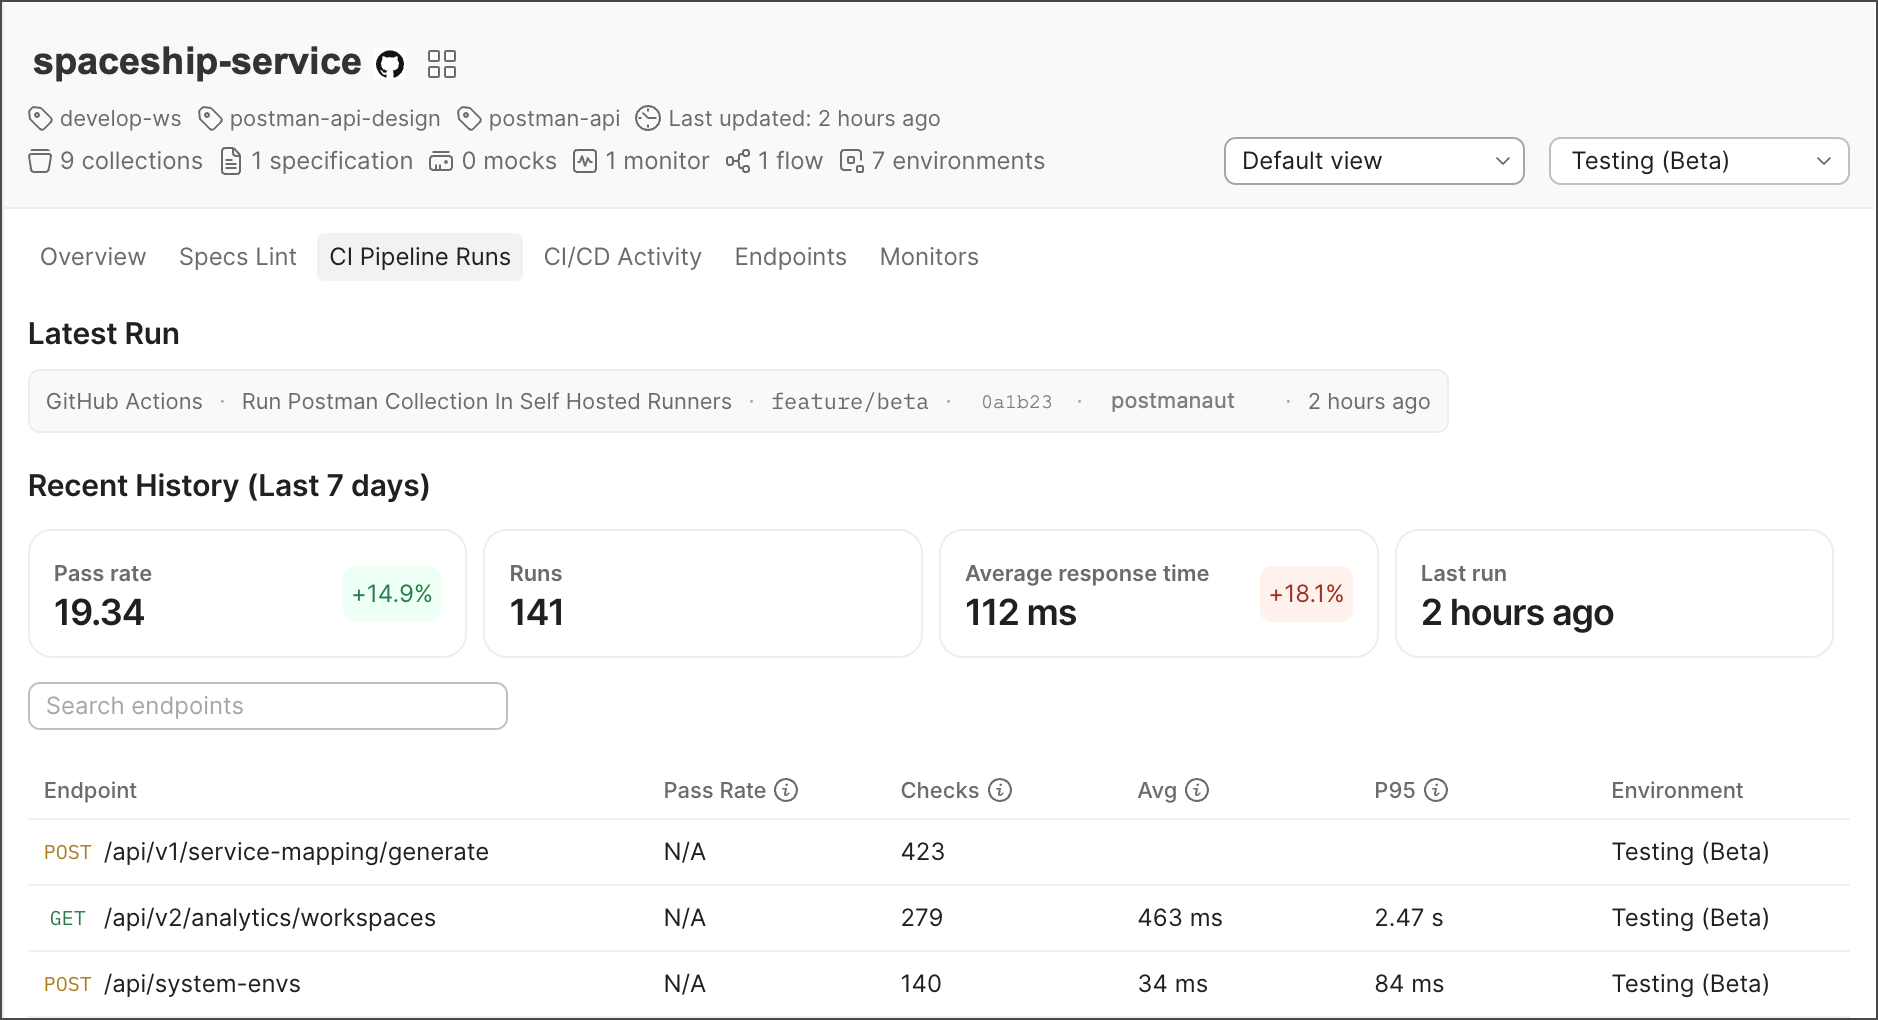 You can check the following metrics in the **CI Pipeline Runs** view:
* **Latest Run** — The details of the last pipeline run, including CI provider, workflow, status, commit, PR number, author, and the time of the run.
* **Recent History (Last 7 days)** — The total number of pipeline runs in the selected time range. Includes the pass rate, total number of runs, average response time, and time since the last run.
Each endpoint in the list displays the name of the endpoint, pass rate (percent of assertions that passed for the endpoint), checks (total number of times the endpoint was run), average response time, p95 percentile response time, and environment.
## Monitor your CI/CD activity
The API Catalog provides a **CI/CD Activity** view that shows the recent activity in your CI/CD pipelines for your APIs. You can integrate with GitHub Actions, GitLab CI, and Jenkins to see your pipeline activity in the API Catalog.
You can check the following metrics in the **CI Pipeline Runs** view:
* **Latest Run** — The details of the last pipeline run, including CI provider, workflow, status, commit, PR number, author, and the time of the run.
* **Recent History (Last 7 days)** — The total number of pipeline runs in the selected time range. Includes the pass rate, total number of runs, average response time, and time since the last run.
Each endpoint in the list displays the name of the endpoint, pass rate (percent of assertions that passed for the endpoint), checks (total number of times the endpoint was run), average response time, p95 percentile response time, and environment.
## Monitor your CI/CD activity
The API Catalog provides a **CI/CD Activity** view that shows the recent activity in your CI/CD pipelines for your APIs. You can integrate with GitHub Actions, GitLab CI, and Jenkins to see your pipeline activity in the API Catalog.
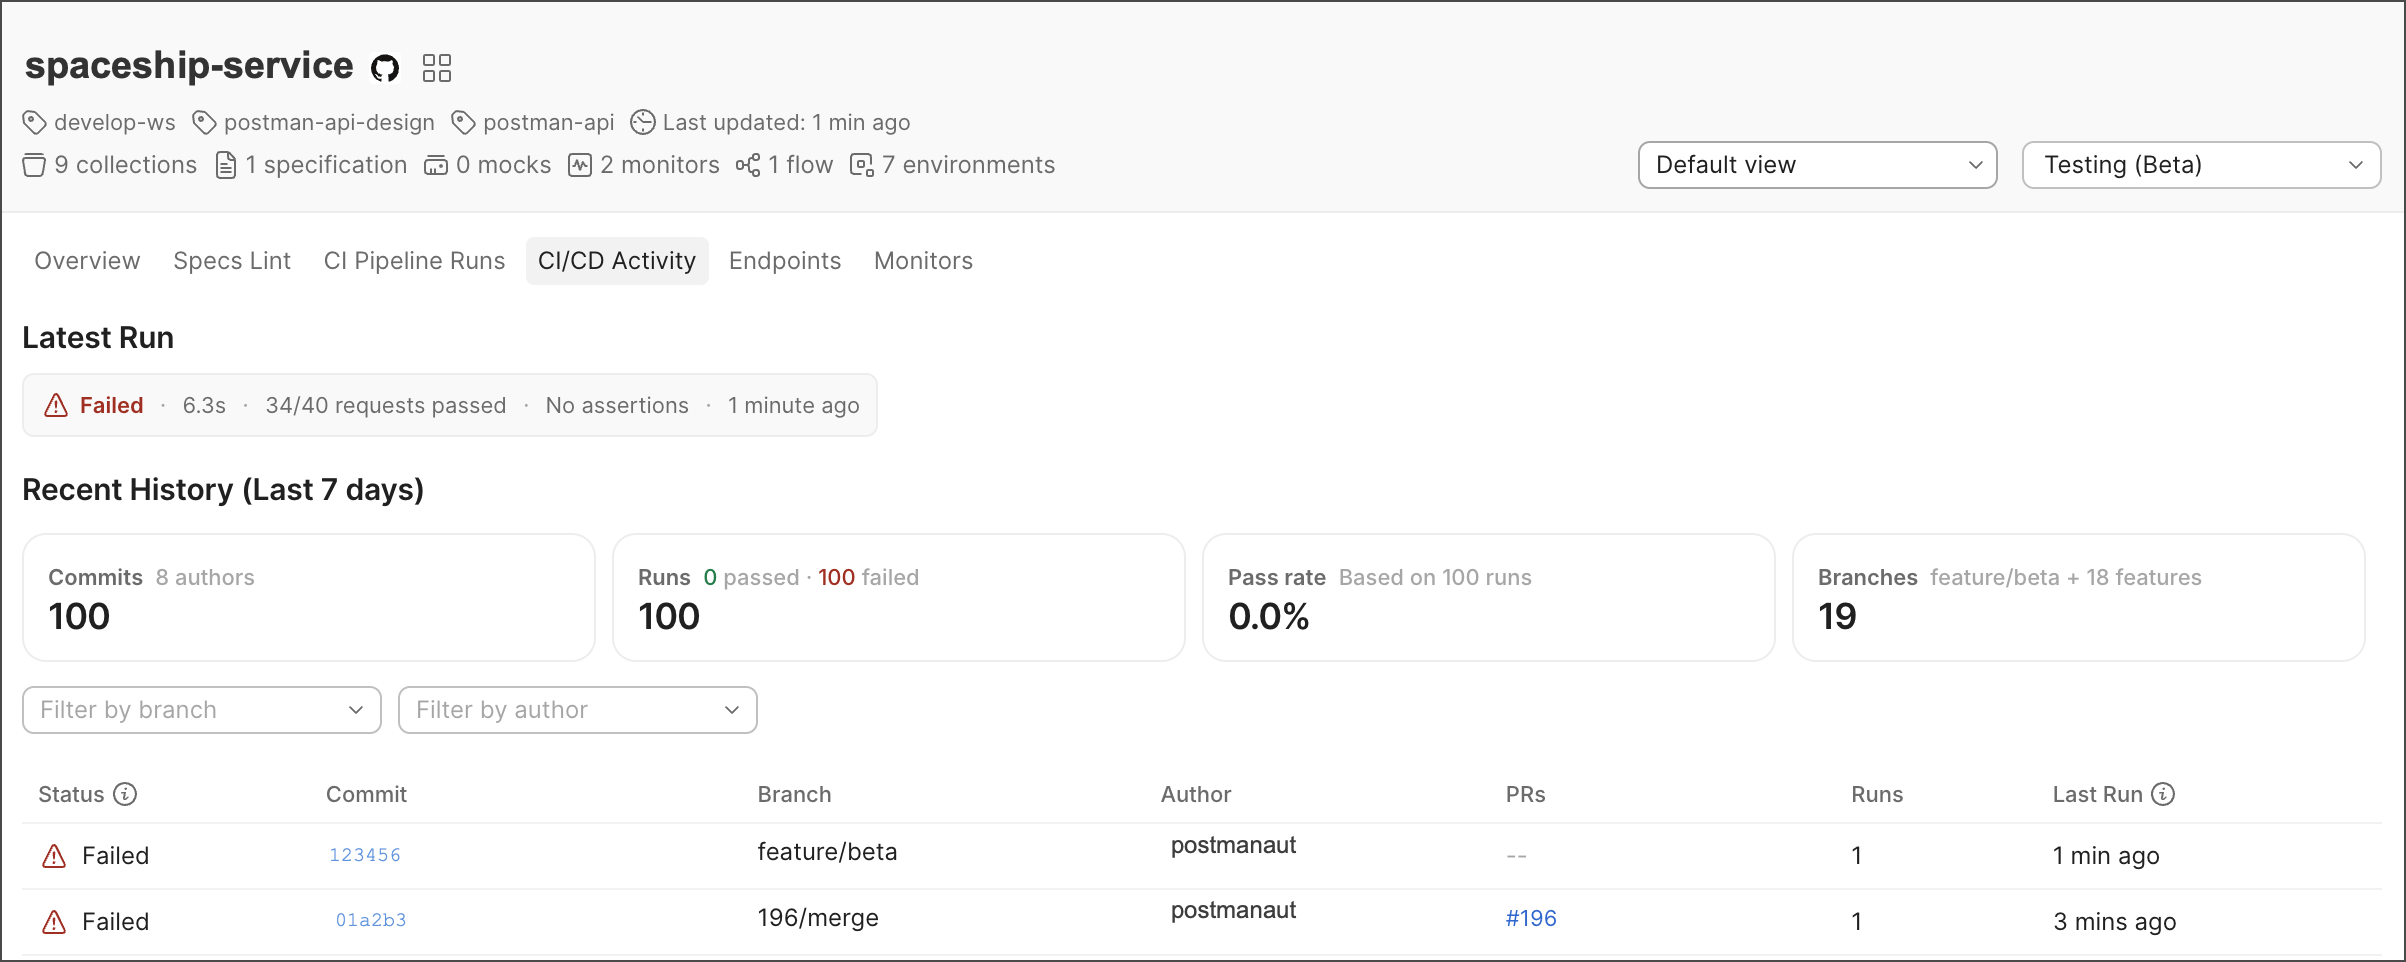 You can check the following metrics in the **CI/CD Activity** view:
* **Latest Run** — The details of the last run, including status, duration, requests passed, assertions, and the time since the last run.
* **Recent History (Last 7 days)** — The total number of commits, runs, pass rate, and branches.
Each commit in the list displays the status, commit number, branch, author, PR number, the number of pipeline runs triggered by that commit, and the time of the last run.
## Analyze your endpoints
The API Catalog provides an **Endpoints** view that displays the performance of your API endpoints over the last seven days. This view is based on traffic data collected by the Postman Insights Agent.
You can search for specific endpoints and filter the list by hostname.
You can check the following metrics in the **CI/CD Activity** view:
* **Latest Run** — The details of the last run, including status, duration, requests passed, assertions, and the time since the last run.
* **Recent History (Last 7 days)** — The total number of commits, runs, pass rate, and branches.
Each commit in the list displays the status, commit number, branch, author, PR number, the number of pipeline runs triggered by that commit, and the time of the last run.
## Analyze your endpoints
The API Catalog provides an **Endpoints** view that displays the performance of your API endpoints over the last seven days. This view is based on traffic data collected by the Postman Insights Agent.
You can search for specific endpoints and filter the list by hostname.
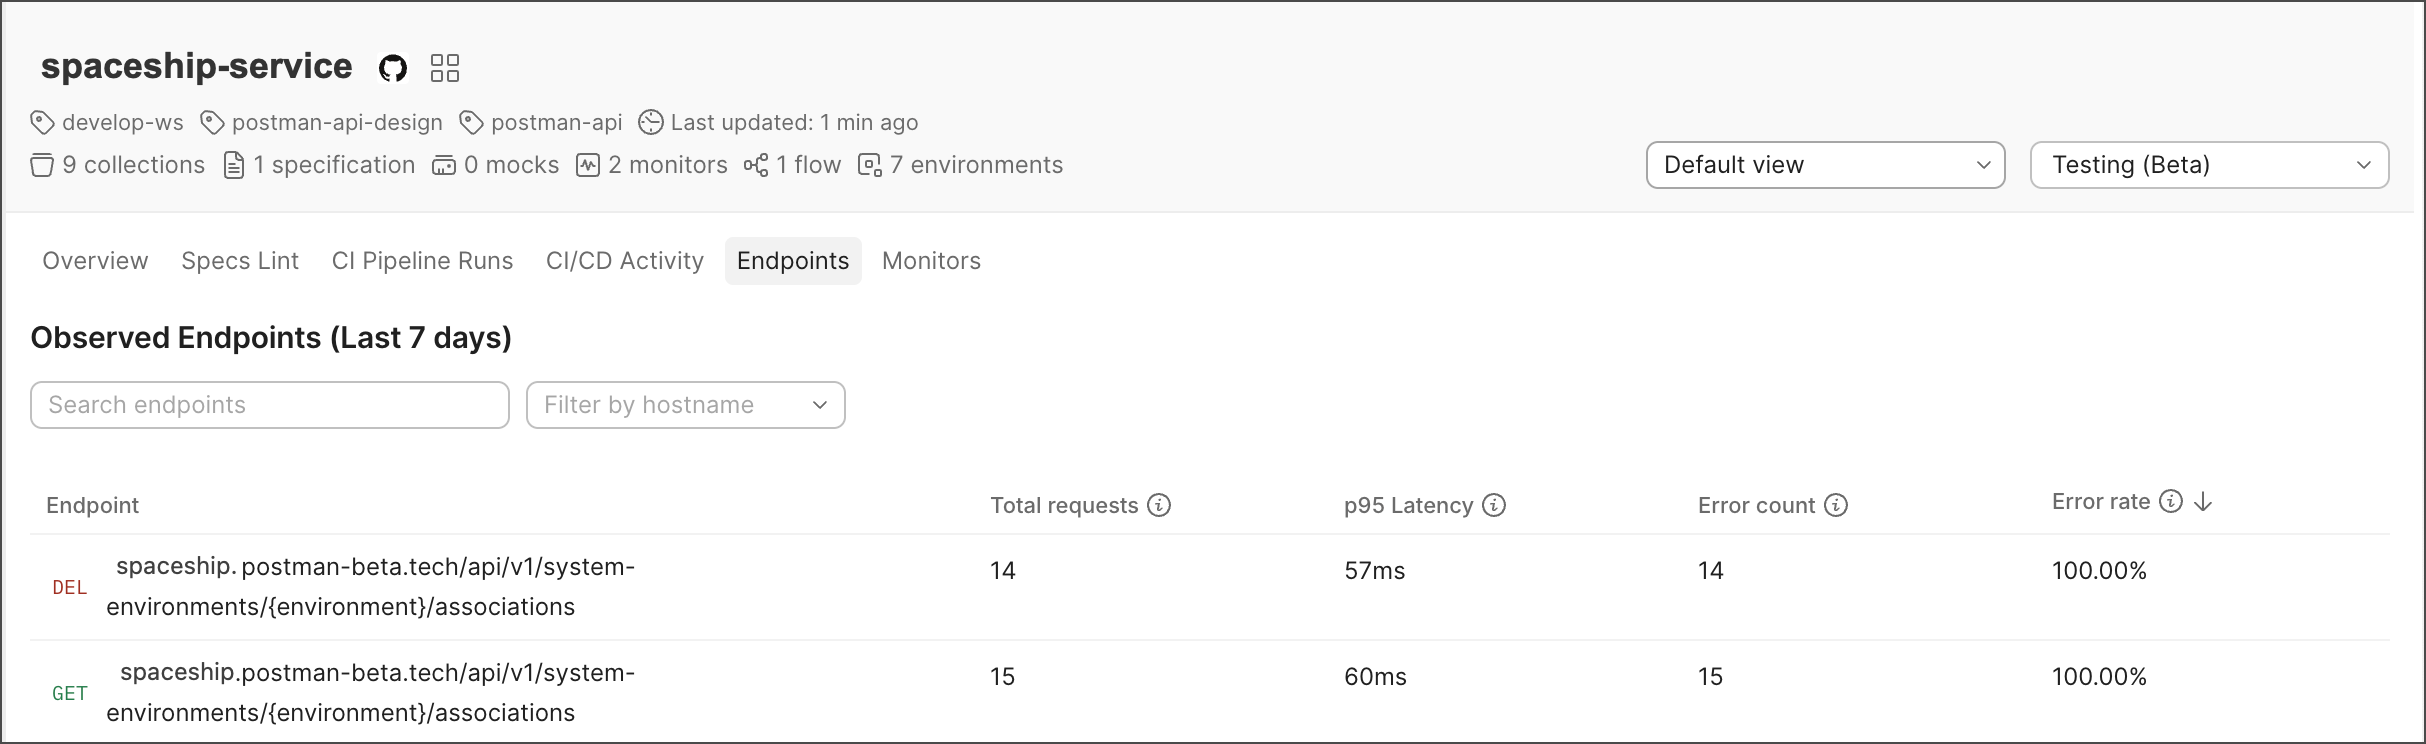 You can check the following metrics in the **Endpoints** view:
* **Endpoint** — The name of the endpoint and request type.
* **Total requests** — The total number of requests observed by the Insights Agent for each endpoint.
* **p95 latency** — The 95th percentile response time for each endpoint.
* **Error count** — The number of requests that resulted in errors (4xx/5xx) for each endpoint.
* **Error rate** — The percentage of requests that resulted in errors (4xx/5xx) for each endpoint.
## Inspect your monitor data
The API Catalog provides a **Monitors** view that displays the status of your collection runs. [Set up a Postman Monitor](/docs/monitoring-your-api/setting-up-monitor) to see your collection runs in the API Catalog.
You can check the following metrics in the **Endpoints** view:
* **Endpoint** — The name of the endpoint and request type.
* **Total requests** — The total number of requests observed by the Insights Agent for each endpoint.
* **p95 latency** — The 95th percentile response time for each endpoint.
* **Error count** — The number of requests that resulted in errors (4xx/5xx) for each endpoint.
* **Error rate** — The percentage of requests that resulted in errors (4xx/5xx) for each endpoint.
## Inspect your monitor data
The API Catalog provides a **Monitors** view that displays the status of your collection runs. [Set up a Postman Monitor](/docs/monitoring-your-api/setting-up-monitor) to see your collection runs in the API Catalog.
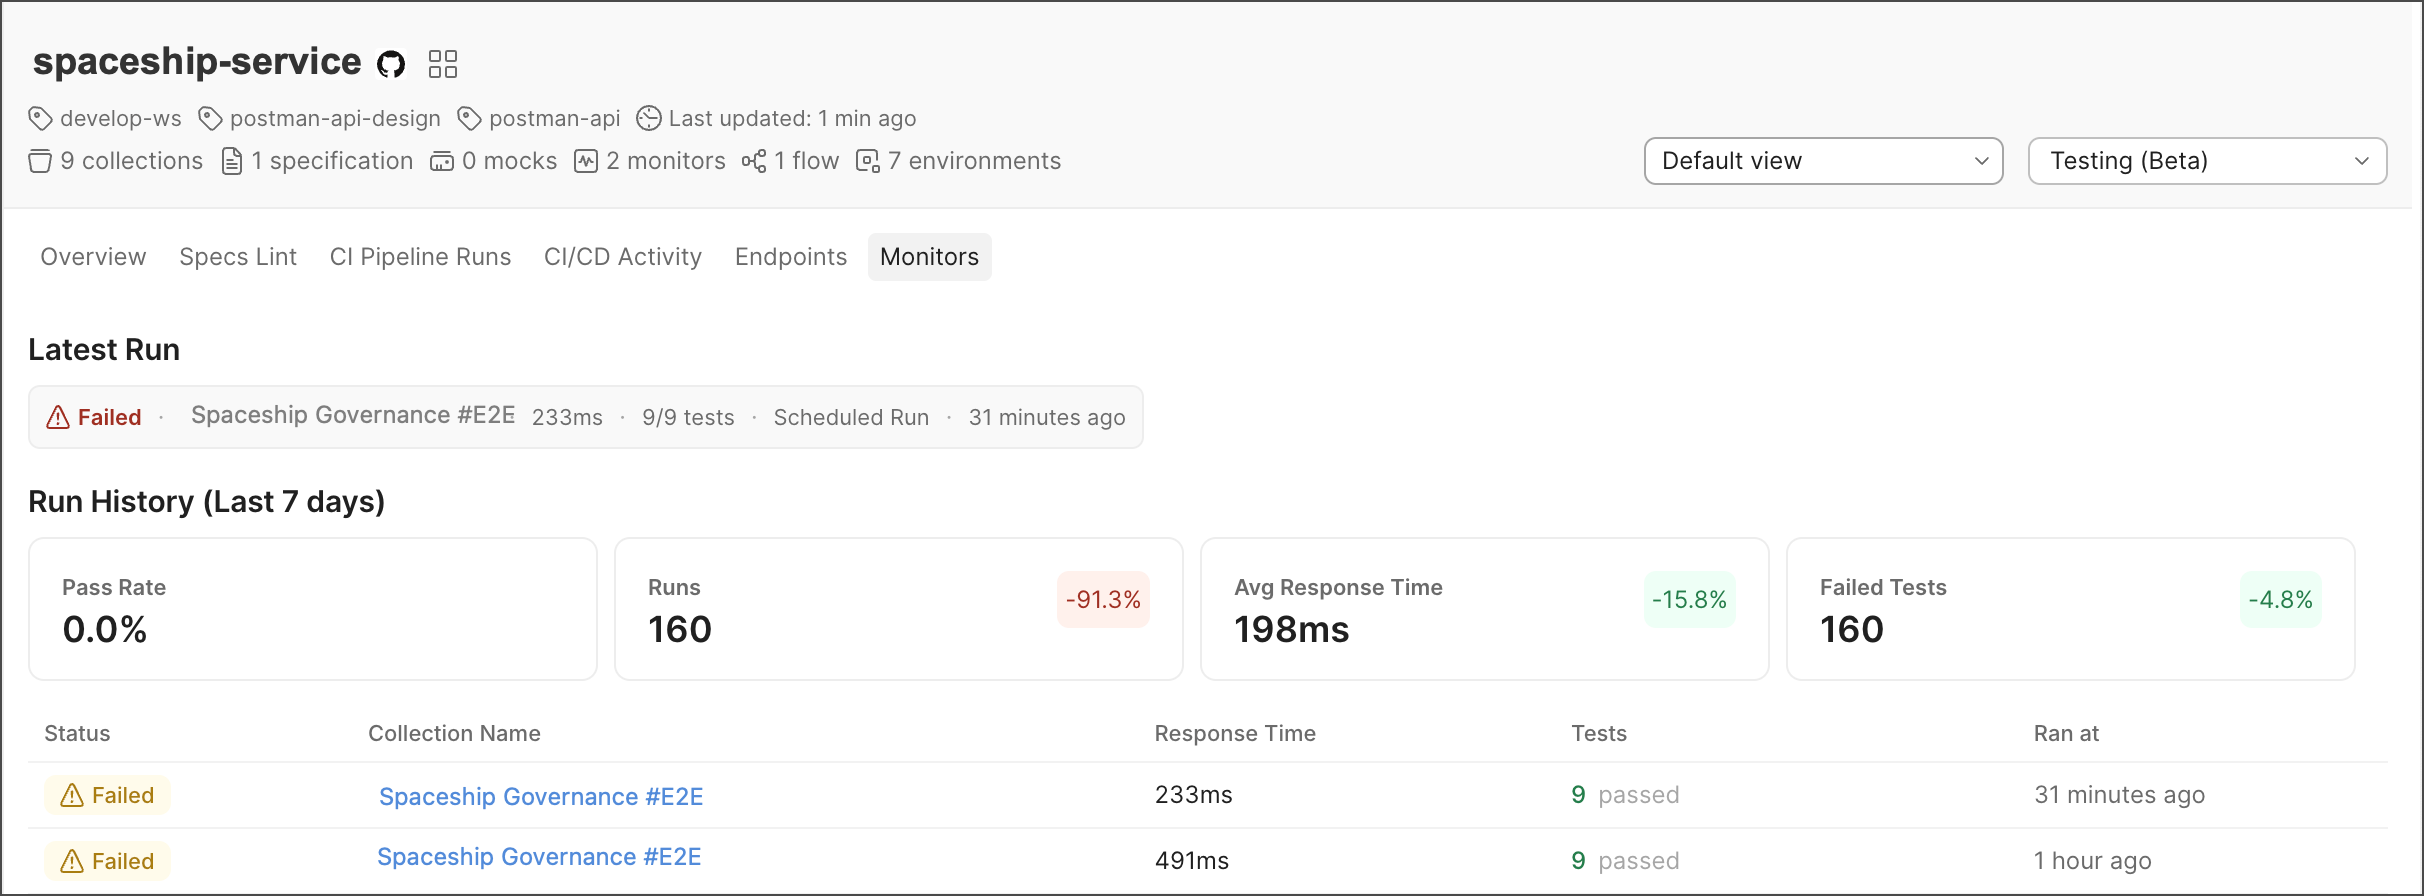 You can check the following metrics in the **Monitors** view:
* **Latest Run** — The details of the last monitor run, including status, collection name, average response time, number of tests passed, type of collection run (scheduled or manual), and the time since the last run.
* **Recent History (Last 7 days)** — The pass rate and percentage of tests passed compared to the last seven days, total number of runs and percentage compared to the last seven days, average response time and percentage compared to the last seven days, and total number of failed tests.
Each collection in the list displays the status of the last run, the name of the collection, response time, total tests passed, and the time since the last run.
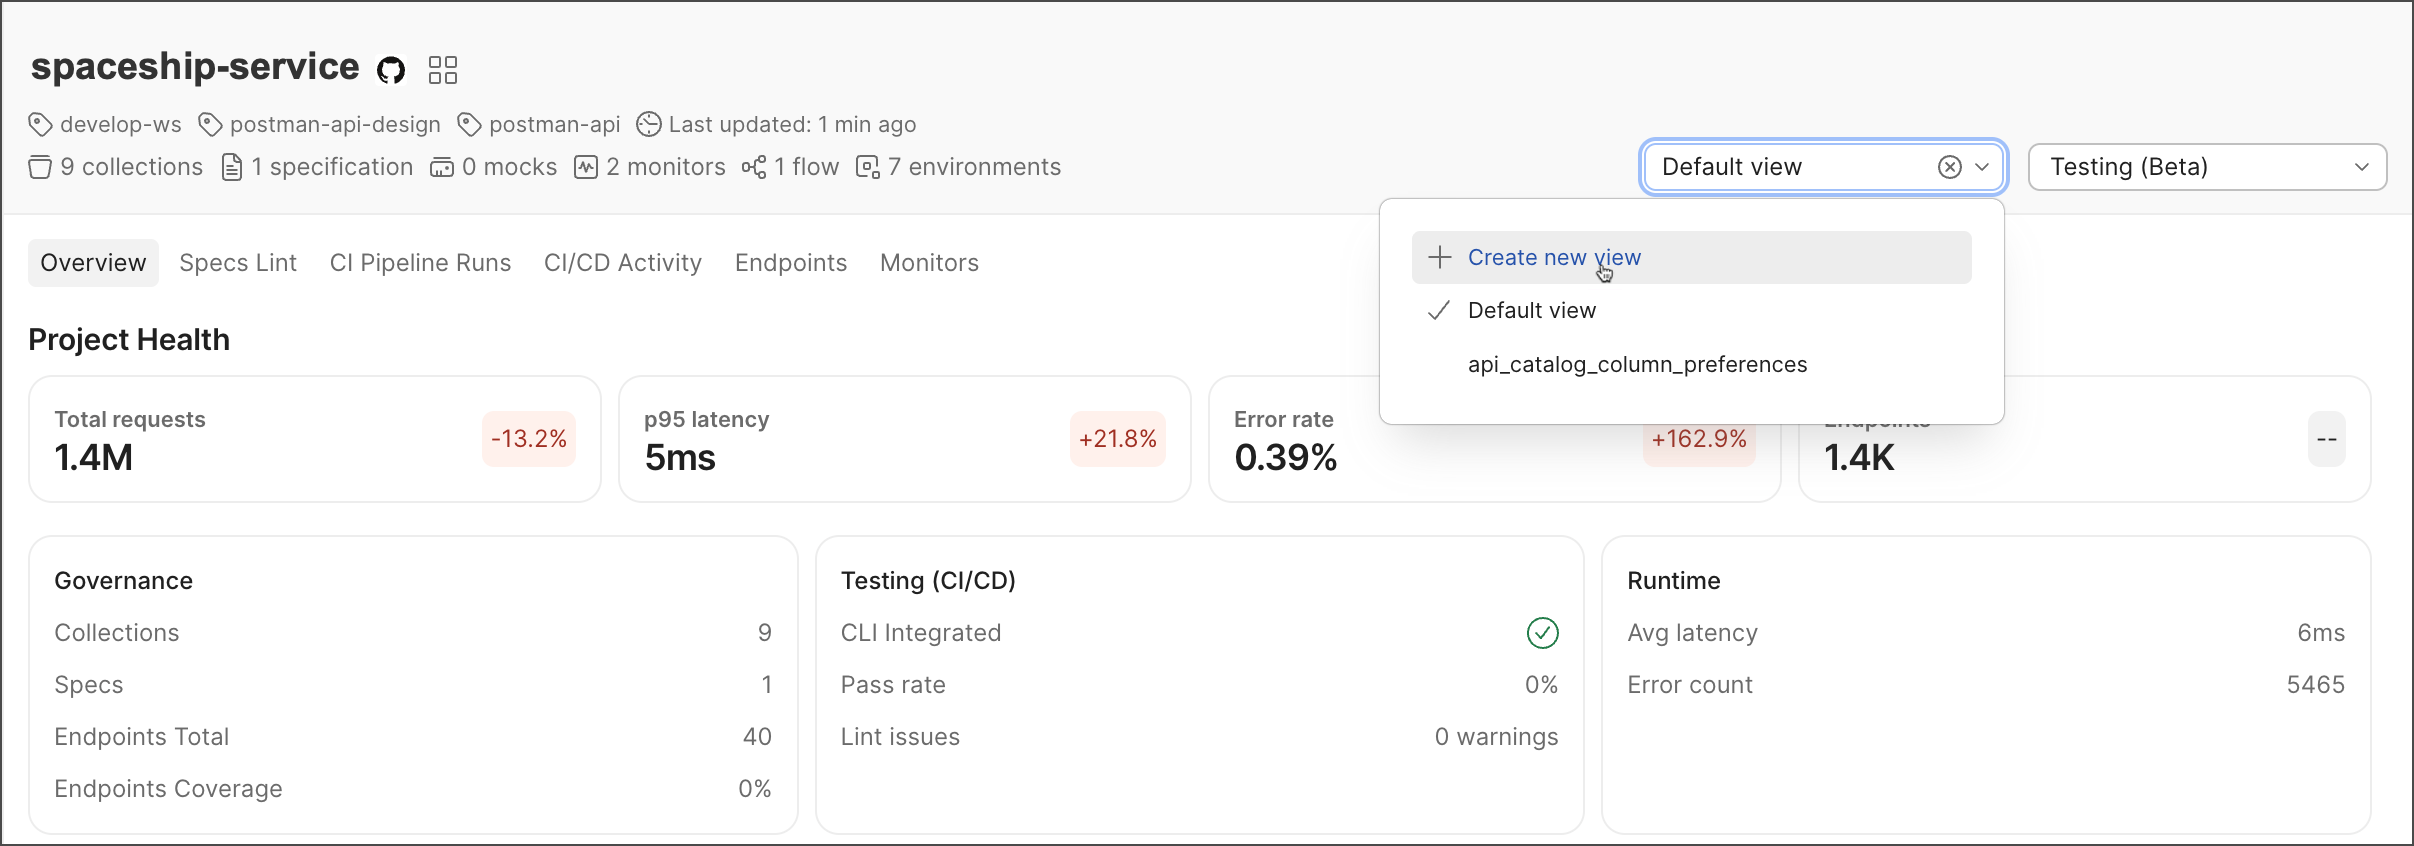
## Customize your project view
API Catalog provides a customizable view of your API projects. You can choose which columns to display in the project list, such as spec conformance, last CLI status, error rate, p95 latency, last monitor run, and owner. You can also save your customized view for easy access later.
To create a customized view, do the following:
1. Click **Default view** dropdown in the project list header.
2. Select **Create new view**.
You can check the following metrics in the **Monitors** view:
* **Latest Run** — The details of the last monitor run, including status, collection name, average response time, number of tests passed, type of collection run (scheduled or manual), and the time since the last run.
* **Recent History (Last 7 days)** — The pass rate and percentage of tests passed compared to the last seven days, total number of runs and percentage compared to the last seven days, average response time and percentage compared to the last seven days, and total number of failed tests.
Each collection in the list displays the status of the last run, the name of the collection, response time, total tests passed, and the time since the last run.
## Customize your project view
API Catalog provides a customizable view of your API projects. You can choose which columns to display in the project list, such as spec conformance, last CLI status, error rate, p95 latency, last monitor run, and owner. You can also save your customized view for easy access later.
To create a customized view, do the following:
1. Click **Default view** dropdown in the project list header.
2. Select **Create new view**.
 3. Enter a name for your view, then press **Enter**.
4. Select the cards and columns you want to display in your view. Navigate through the different sections (**Overview**, **Specs Lint**, **CI Pipeline Runs**, **CI/CD Activity**, **Endpoints**, and **Monitors**) to select the metrics you want to include.
3. Enter a name for your view, then press **Enter**.
4. Select the cards and columns you want to display in your view. Navigate through the different sections (**Overview**, **Specs Lint**, **CI Pipeline Runs**, **CI/CD Activity**, **Endpoints**, and **Monitors**) to select the metrics you want to include.
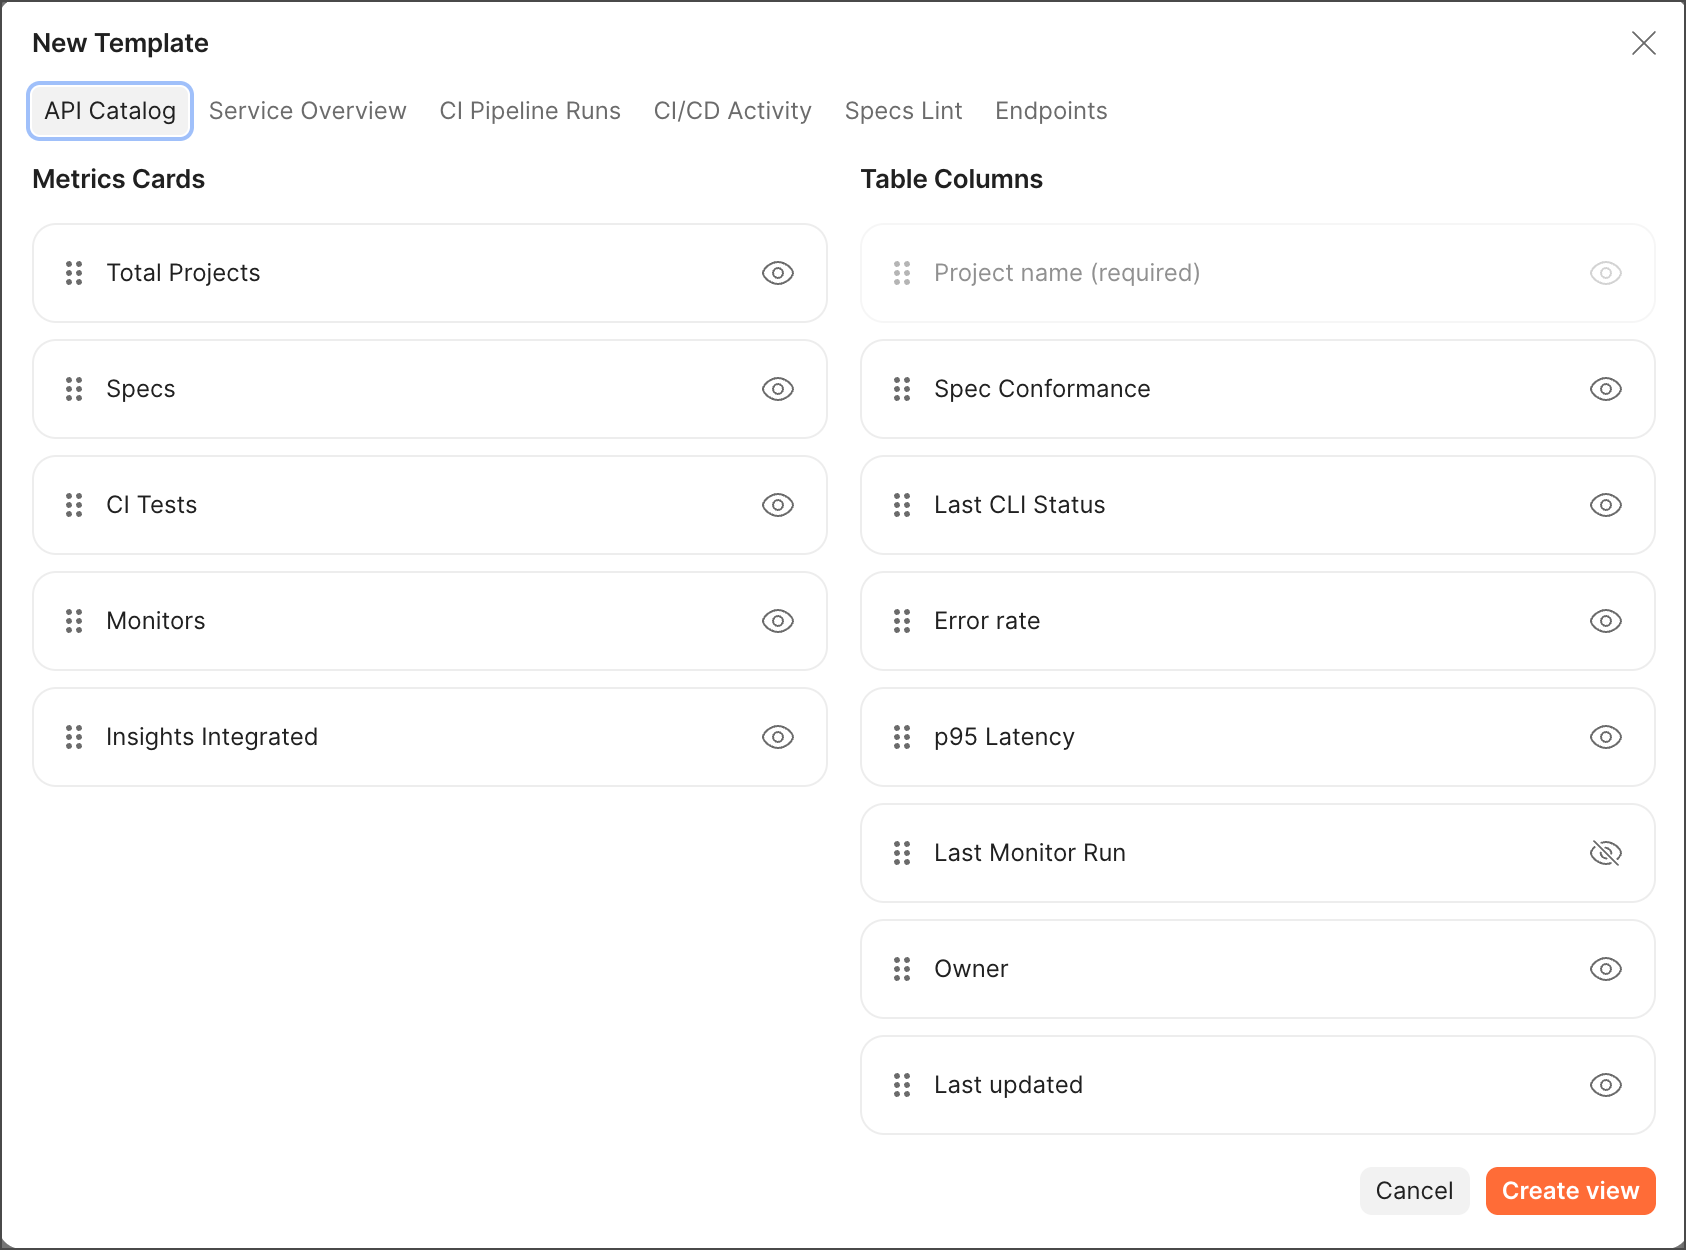 5. Click **Create view** to save your customized view. Your new view will now be available when you click the **Default view** dropdown later. You can switch between different views to see the information that's most relevant to you at any given time.
You can also select the environment you want to see data for in your view. For example, you can switch between staging and production environments to compare the performance of your APIs in different environments. Click the **Select Environment** dropdown in the project list header to switch between environments.
5. Click **Create view** to save your customized view. Your new view will now be available when you click the **Default view** dropdown later. You can switch between different views to see the information that's most relevant to you at any given time.
You can also select the environment you want to see data for in your view. For example, you can switch between staging and production environments to compare the performance of your APIs in different environments. Click the **Select Environment** dropdown in the project list header to switch between environments.