***
title: The Log block
approved: 2025-07-21T00:00:00.000Z
topictype: reference
slug: docs/postman-flows/reference/blocks/log
max-toc-depth: 2
ux: v12
-------
The **Log** block accepts information to its input port and sends the information to the [Postman Console](/docs/sending-requests/response-data/troubleshooting-api-requests/). The **Log** block is useful for [debugging flows](/docs/postman-flows/build-flows/troubleshoot/troubleshoot/).
## Input
The **Log** block has a single input port that accepts data from any block's output port. If you connect multiple output ports to a **Log** blocks' input port, all the incoming data is sent to the Postman Console in the order it was received.
If you have any **HTTP Request** blocks in your flow, the requests they send are logged automatically as network events. You don't need to add **Log** blocks to capture that output.
## Setup
Connect one or more block's output port to the **Log** block's input port to send the incoming data to the Postman Console. Click  **View logs** to open the Postman Console.
Within the Postman Console, optionally click
**View logs** to open the Postman Console.
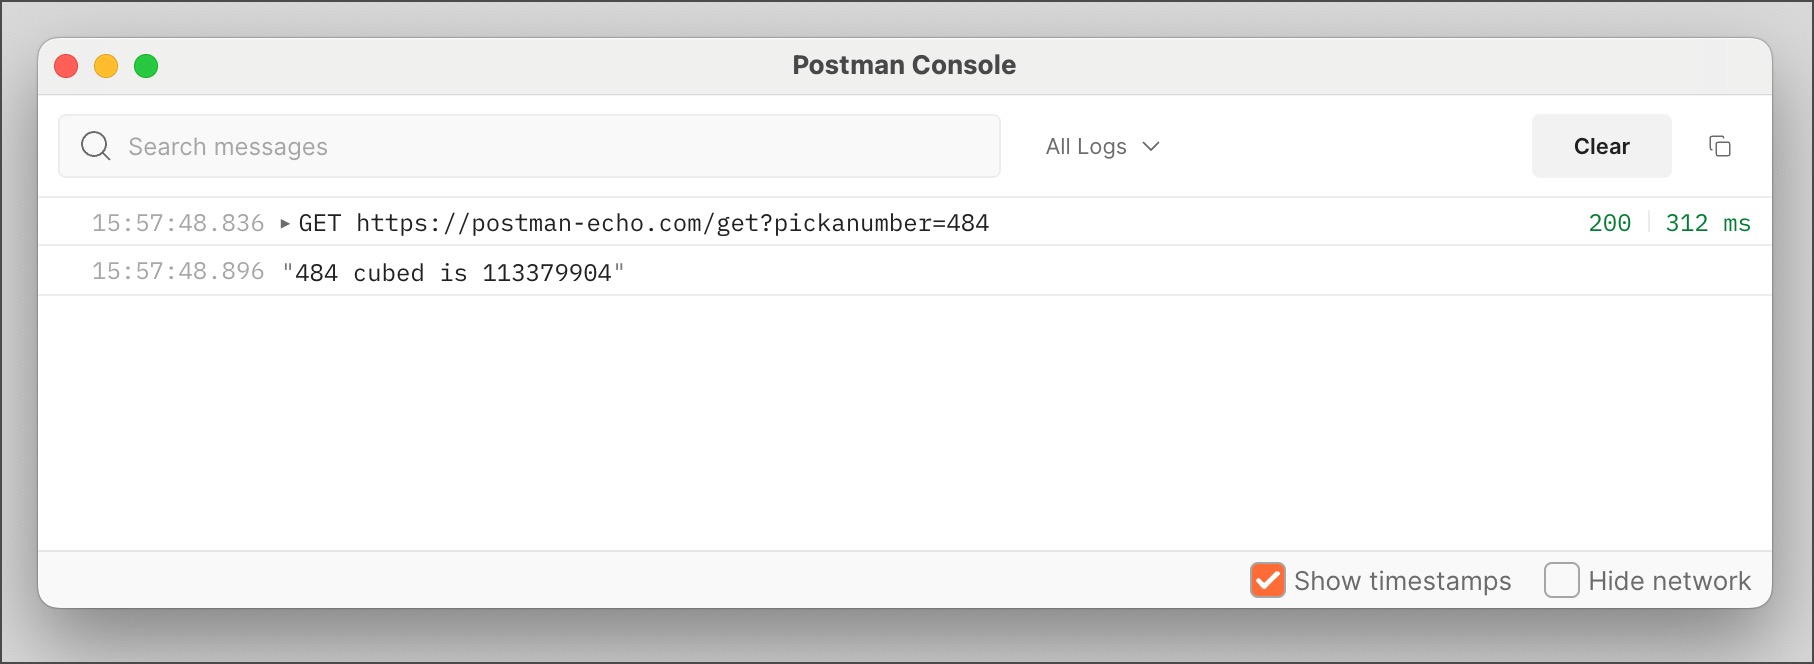
Within the Postman Console, optionally click  to open a copy of the console in its own window. There you find the following checkboxes:
* **Show timestamps** prefaces each log entry with a timestamp in `HH:MM:SS.MS` format where `HH` is the hour, `MM` is the minute, `SS` is the second, and `MS` is the millisecond.
* **Hide network** hides the network events described in the [Input](#input) section.
## Example
To see the **Log** block in an example flow, check out [Flow Snippets: Logging to Console](https://www.postman.com/postman/flows-snippets/flow/63b8b07ea365885b55bc51f9).
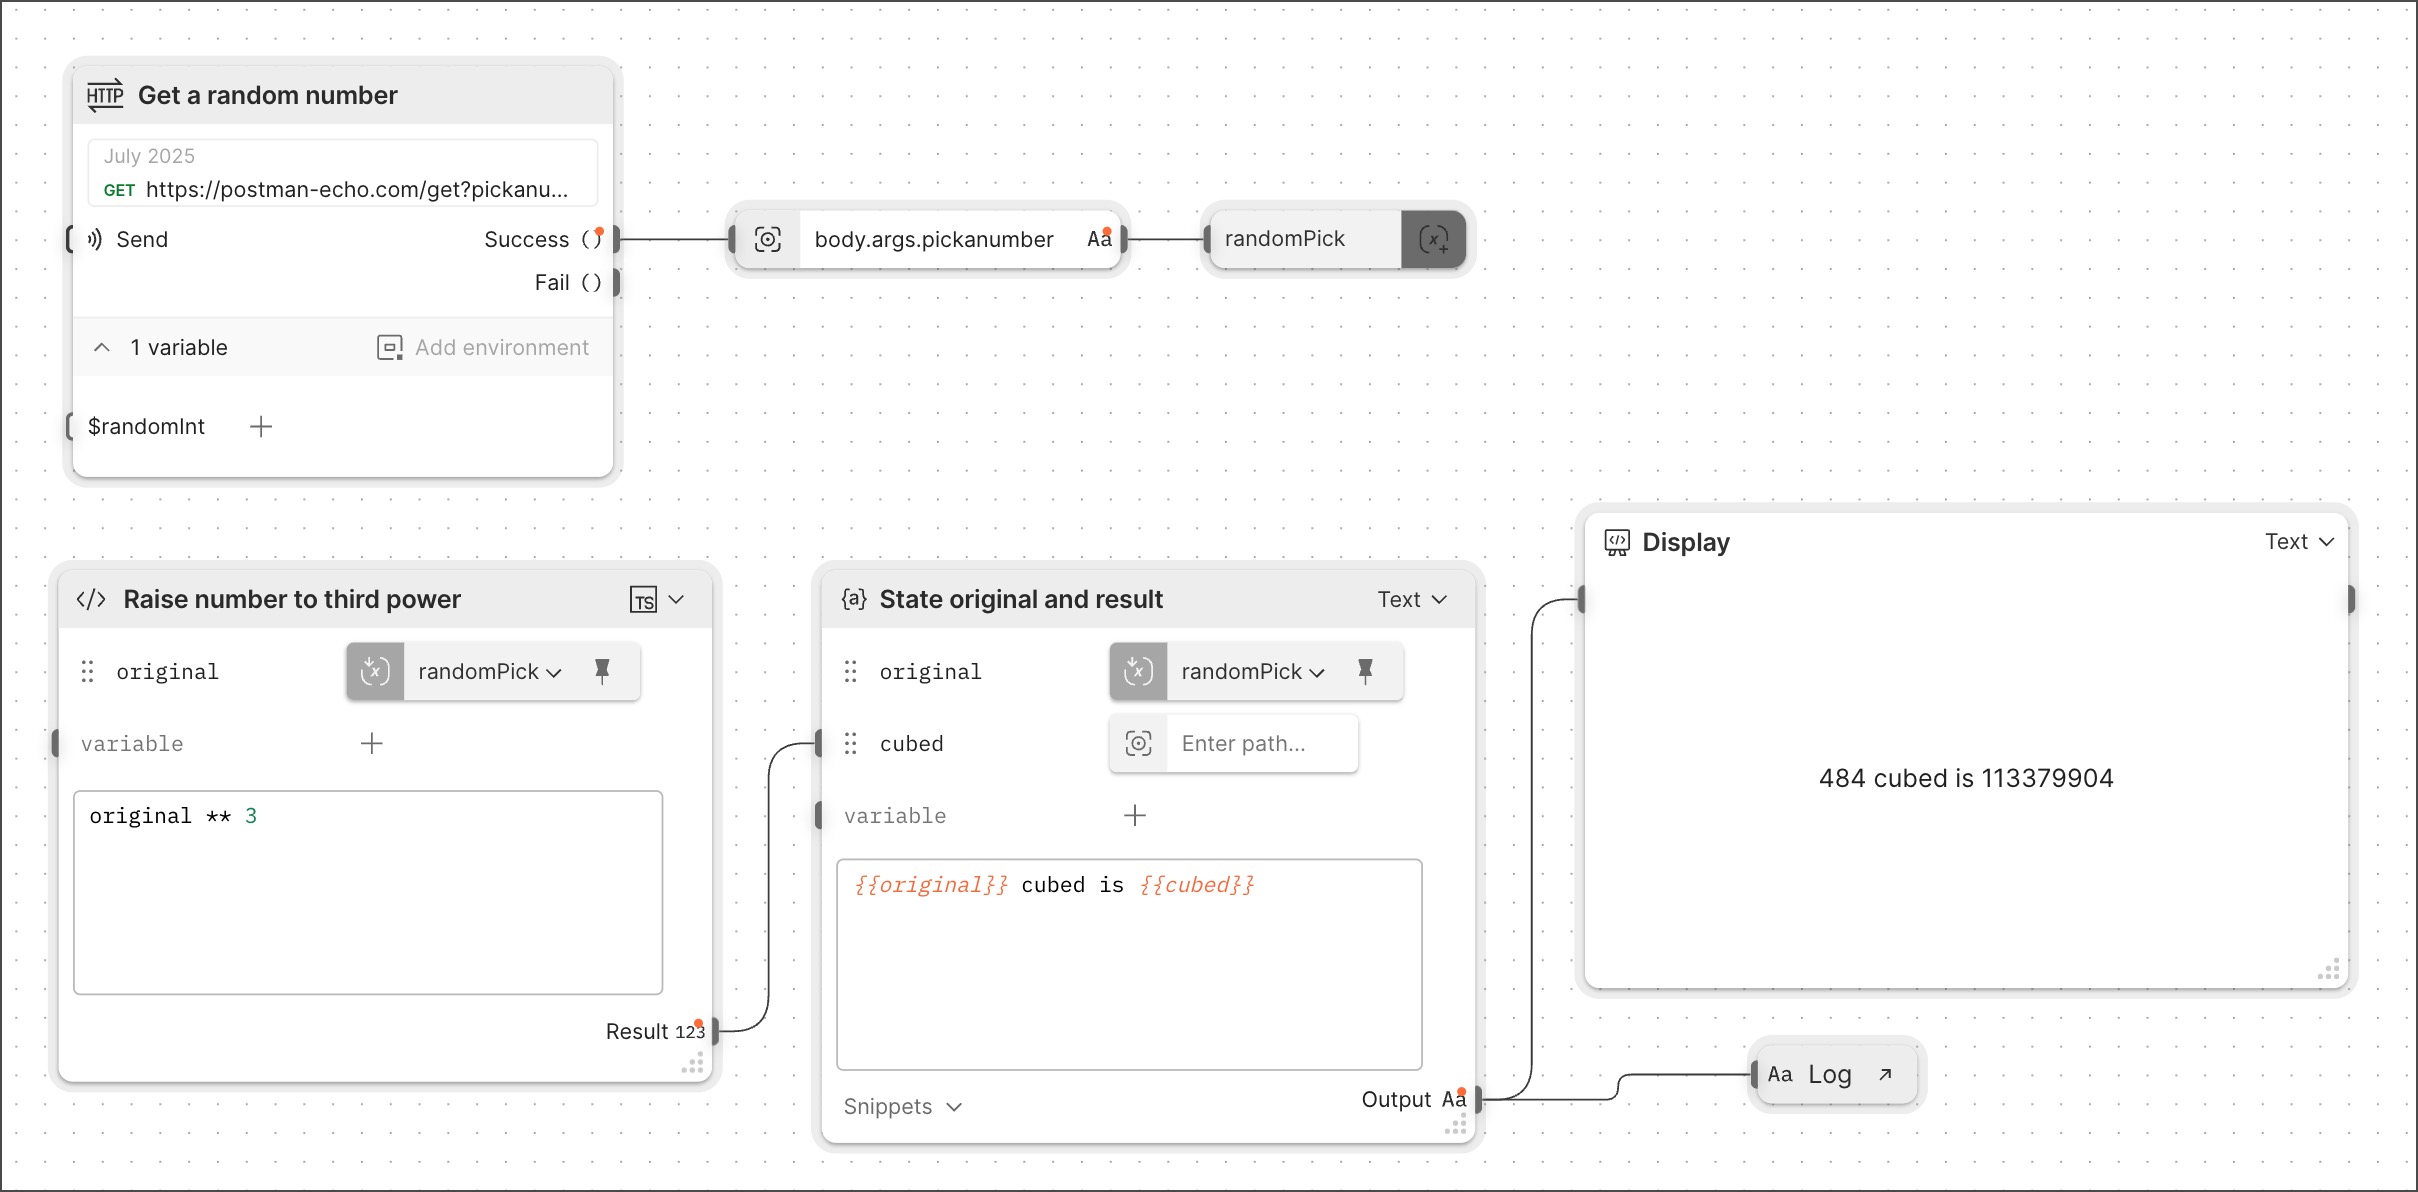
The example flow below obtains a random integer, raises it to the third power, outputs a string stating both values, and logs the string.
to open a copy of the console in its own window. There you find the following checkboxes:
* **Show timestamps** prefaces each log entry with a timestamp in `HH:MM:SS.MS` format where `HH` is the hour, `MM` is the minute, `SS` is the second, and `MS` is the millisecond.
* **Hide network** hides the network events described in the [Input](#input) section.
## Example
To see the **Log** block in an example flow, check out [Flow Snippets: Logging to Console](https://www.postman.com/postman/flows-snippets/flow/63b8b07ea365885b55bc51f9).
The example flow below obtains a random integer, raises it to the third power, outputs a string stating both values, and logs the string.
 Both the network event (that is, the HTTP request) and the output string appear in the log. With the Postman Console in its own window, you can turn on **Show timestamps**. In this case that reveals that the HTTP request was logged 60 milliseconds before the output.