> For clean Markdown content of this page, append .md to this URL. For the complete documentation index, see https://learning.postman.com/llms.txt.
# Visualize data in Postman Flows
The **Display** block accepts information from other blocks and creates a visualization of that information. You can select from several visualization types.
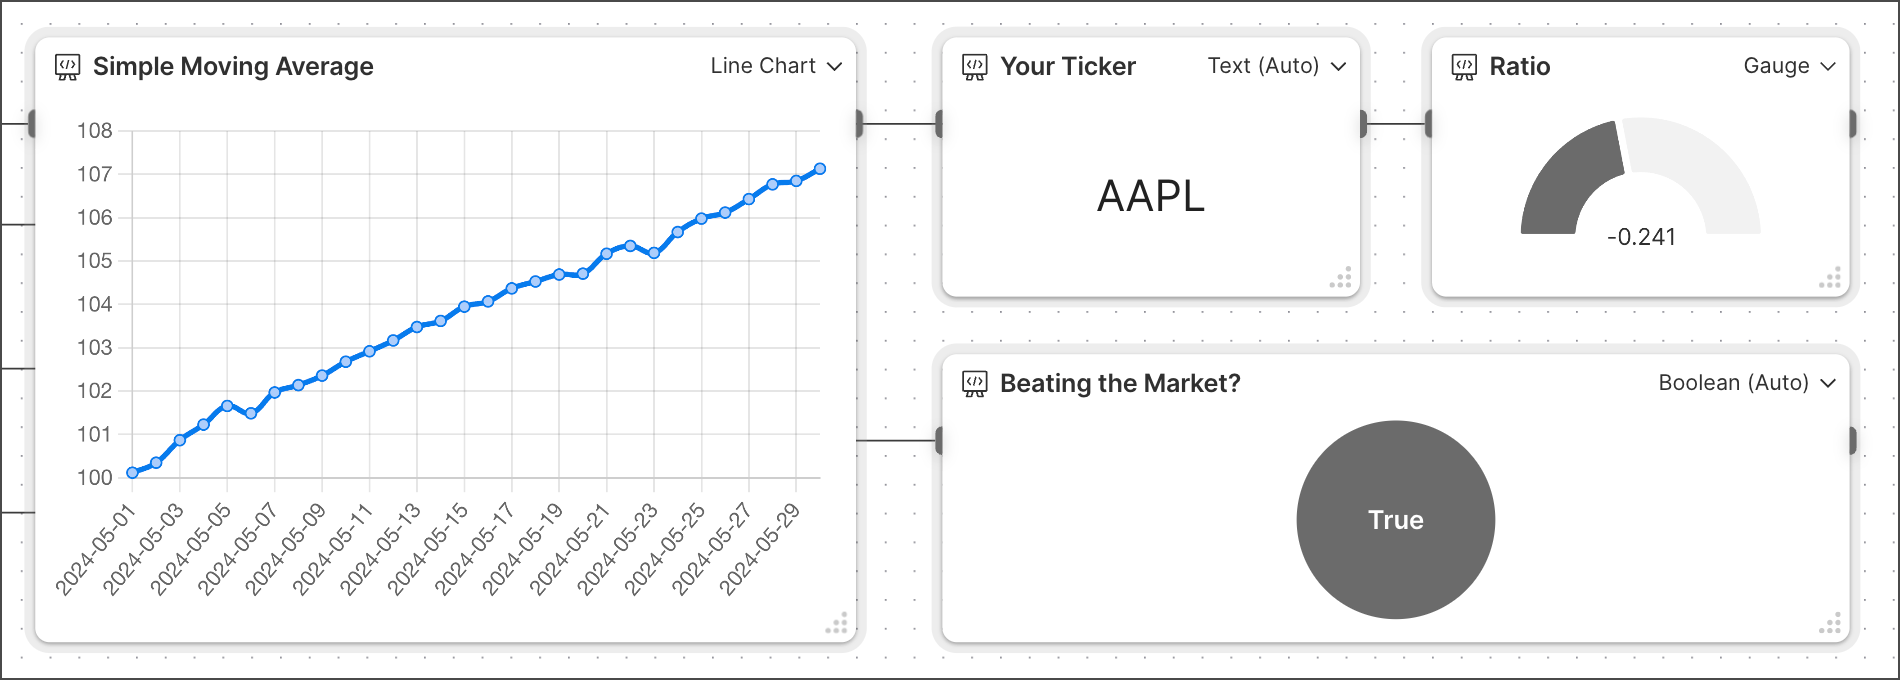 This image shows four types of output visualization types: [line chart](#line-chart), [text](#text), [gauge](#gauge), and [Boolean](#boolean). You can find links to example flows for other visualization types in the [Visualization types](#visualization-types) section.
## Visualization types
The **Display** block supports the following types of output:
| | | |
| ----------------------------- | --------------------------------------------------------------------------------------------------------------------- | --------------------------------------------------------------------------------------------------- |
| [**Text**](#text) | Displays incoming information as text. | [Text example](https://www.postman.com/postman/flows-snippets/flow/6414e20b95e5e70033f028c9) |
| **Number** | Displays an integer if the information connected to the input is a number. | [Number example](https://www.postman.com/postman/flows-snippets/flow/6414e8eb95e5e70033f028d4) |
| [**Boolean**](#boolean) | Displays a true or false value. If the value connected to the input isn't true/false or 0/1, it always displays true. | [Boolean example](https://www.postman.com/postman/flows-snippets/flow/6414ebb88c4c54003a4ad797) |
| **Date & Time** | If the incoming text or number can be interpreted as a date, it displays in `DD MMM, YYYY HH:MM:SS am/pm` format. | [Date & Time example](https://www.postman.com/postman/flows-snippets/flow/66d09e1c8bfc77003d0398ca) |
| **JSON** | Shows the information connected to the input in JSON format, enabling you to view and select data. | [JSON example](https://www.postman.com/postman/flows-snippets/flow/6414ec507221e9003a7a5384) |
| **Bar Chart** | Shows one or more sets of information connected to the input. | [Bar chart example](https://www.postman.com/postman/flows-snippets/flow/6411f07120794b0039e76839) |
| [**Line Chart**](#line-chart) | Shows a line for X and Y coordinates connected to the input. | [Line chart example](https://www.postman.com/postman/flows-snippets/flow/641242fd8c4c54003a4ad507) |
| [**Gauge**](#gauge) | Shows a number when the input is a percentage. | [Gauge example](https://www.postman.com/postman/flows-snippets/flow/64124134c224290033fcb08b) |
| **Table** | Shows the connected input as a table with rows and columns. | [Table example](https://www.postman.com/postman/flows-snippets/flow/64124607c224290033fcb092) |
| **Markdown** | Shows the text with all of the Markdown annotations displayed. | [Markdown example](https://www.postman.com/postman/flows-snippets/flow/641249577221e9003a7a5107) |
| **HTML** | Accepts valid HTML and renders it as formatted HTML. | [HTML example](https://www.postman.com/postman/flows-snippets/flow/66d0966563df0b00328de042) |
| **URL** | Shows a hyperlink to the URL that's connected to the input. | [URL example](https://www.postman.com/postman/flows-snippets/flow/64124dc8c224290033fcb098) |
| **Image** | Shows an image from a URL that's connected to the input. | [Image example](https://www.postman.com/postman/flows-snippets/flow/64124e997221e9003a7a510c) |
| **Video** | Shows a video from a URL that's connected to the input and enables it to be played. | [Video example](https://www.postman.com/postman/flows-snippets/flow/64124f65c224290033fcb09b) |
| **YouTube** | Shows a YouTube video from a URL that's connected to the input and enables it to be played. | [YouTube example](https://www.postman.com/postman/flows-snippets/flow/6414ef7bc224290033fcb310) |
## Text
When a **Display** block receives a string, it automatically selects the **Text** visualization type and shows the text.
To create an example text **Display** block, do the following:
1. Create an **HTTP Request** block with a GET request to `postman-echo.com/get`.
2. Create and connect a **Select** block to the **HTTP Request** block and enter `body.headers.host`. This selects a string from the response.
3. Create a **Display > Text** block, then connect the **Select** block to the **Display** block.
To adjust the text size, select the **Display** block, then click
This image shows four types of output visualization types: [line chart](#line-chart), [text](#text), [gauge](#gauge), and [Boolean](#boolean). You can find links to example flows for other visualization types in the [Visualization types](#visualization-types) section.
## Visualization types
The **Display** block supports the following types of output:
| | | |
| ----------------------------- | --------------------------------------------------------------------------------------------------------------------- | --------------------------------------------------------------------------------------------------- |
| [**Text**](#text) | Displays incoming information as text. | [Text example](https://www.postman.com/postman/flows-snippets/flow/6414e20b95e5e70033f028c9) |
| **Number** | Displays an integer if the information connected to the input is a number. | [Number example](https://www.postman.com/postman/flows-snippets/flow/6414e8eb95e5e70033f028d4) |
| [**Boolean**](#boolean) | Displays a true or false value. If the value connected to the input isn't true/false or 0/1, it always displays true. | [Boolean example](https://www.postman.com/postman/flows-snippets/flow/6414ebb88c4c54003a4ad797) |
| **Date & Time** | If the incoming text or number can be interpreted as a date, it displays in `DD MMM, YYYY HH:MM:SS am/pm` format. | [Date & Time example](https://www.postman.com/postman/flows-snippets/flow/66d09e1c8bfc77003d0398ca) |
| **JSON** | Shows the information connected to the input in JSON format, enabling you to view and select data. | [JSON example](https://www.postman.com/postman/flows-snippets/flow/6414ec507221e9003a7a5384) |
| **Bar Chart** | Shows one or more sets of information connected to the input. | [Bar chart example](https://www.postman.com/postman/flows-snippets/flow/6411f07120794b0039e76839) |
| [**Line Chart**](#line-chart) | Shows a line for X and Y coordinates connected to the input. | [Line chart example](https://www.postman.com/postman/flows-snippets/flow/641242fd8c4c54003a4ad507) |
| [**Gauge**](#gauge) | Shows a number when the input is a percentage. | [Gauge example](https://www.postman.com/postman/flows-snippets/flow/64124134c224290033fcb08b) |
| **Table** | Shows the connected input as a table with rows and columns. | [Table example](https://www.postman.com/postman/flows-snippets/flow/64124607c224290033fcb092) |
| **Markdown** | Shows the text with all of the Markdown annotations displayed. | [Markdown example](https://www.postman.com/postman/flows-snippets/flow/641249577221e9003a7a5107) |
| **HTML** | Accepts valid HTML and renders it as formatted HTML. | [HTML example](https://www.postman.com/postman/flows-snippets/flow/66d0966563df0b00328de042) |
| **URL** | Shows a hyperlink to the URL that's connected to the input. | [URL example](https://www.postman.com/postman/flows-snippets/flow/64124dc8c224290033fcb098) |
| **Image** | Shows an image from a URL that's connected to the input. | [Image example](https://www.postman.com/postman/flows-snippets/flow/64124e997221e9003a7a510c) |
| **Video** | Shows a video from a URL that's connected to the input and enables it to be played. | [Video example](https://www.postman.com/postman/flows-snippets/flow/64124f65c224290033fcb09b) |
| **YouTube** | Shows a YouTube video from a URL that's connected to the input and enables it to be played. | [YouTube example](https://www.postman.com/postman/flows-snippets/flow/6414ef7bc224290033fcb310) |
## Text
When a **Display** block receives a string, it automatically selects the **Text** visualization type and shows the text.
To create an example text **Display** block, do the following:
1. Create an **HTTP Request** block with a GET request to `postman-echo.com/get`.
2. Create and connect a **Select** block to the **HTTP Request** block and enter `body.headers.host`. This selects a string from the response.
3. Create a **Display > Text** block, then connect the **Select** block to the **Display** block.
To adjust the text size, select the **Display** block, then click  **Additional Settings > Text size**.
4. Click **Run** in the Flows toolbar. The **Display** block displays the `postman-echo.com` string from the `body.headers.host` response.
## Boolean
When a **Display** block receives a message that's either true or false, it automatically selects the **Boolean** visualization type, displaying **True** or **False**.
To create an example Boolean **Display** block, do the following:
1. Create an **HTTP Request** block with a GET request to `postman-echo.com/get`.
2. Create and connect an **Evaluate > FQL** block to the **HTTP Request** block and enter the `value1.http.status = 200` [FQL](/flows/flows-query-language/introduction-to-fql/) query. This query checks if the response returns a `200` status code.
3. Create and connect a **Display > Boolean** block to the **Evaluate** block and run the flow. If the response has a `200` status code, the **Display** block shows a circle that says **True**. If not, the circle shows **False**.
## Line chart
The **Line Chart** visualization type accepts two lists and plots them on X and Y axes in a chart. The first list received is the X axis, and the second list is the Y axis.
To create an example line chart **Display** block, do the following:
1. In the **Start** block, click
**Additional Settings > Text size**.
4. Click **Run** in the Flows toolbar. The **Display** block displays the `postman-echo.com` string from the `body.headers.host` response.
## Boolean
When a **Display** block receives a message that's either true or false, it automatically selects the **Boolean** visualization type, displaying **True** or **False**.
To create an example Boolean **Display** block, do the following:
1. Create an **HTTP Request** block with a GET request to `postman-echo.com/get`.
2. Create and connect an **Evaluate > FQL** block to the **HTTP Request** block and enter the `value1.http.status = 200` [FQL](/flows/flows-query-language/introduction-to-fql/) query. This query checks if the response returns a `200` status code.
3. Create and connect a **Display > Boolean** block to the **Evaluate** block and run the flow. If the response has a `200` status code, the **Display** block shows a circle that says **True**. If not, the circle shows **False**.
## Line chart
The **Line Chart** visualization type accepts two lists and plots them on X and Y axes in a chart. The first list received is the X axis, and the second list is the Y axis.
To create an example line chart **Display** block, do the following:
1. In the **Start** block, click  **Add input**. Enter "List 1" for the first input, then add another input and enter "List 2". Change both inputs to
  **List**.
2. In the right sidebar, select
**List**.
2. In the right sidebar, select  **Scenarios** > **Create scenario**.
3. Enter `[10, 20, 30, 40, 50, 60, 70]` for **List 1**'s data and `[100, 200, 300, 400]` for **List 2**'s data. Click
**Scenarios** > **Create scenario**.
3. Enter `[10, 20, 30, 40, 50, 60, 70]` for **List 1**'s data and `[100, 200, 300, 400]` for **List 2**'s data. Click  **Save**.
4. Create a **Display > Line Chart** block, then connect the **List 1** and **List 2** inputs in the **Start** block to the **Display** block.
5. Click **Run** in the Flows toolbar. A line chart displays the data on their respective axes.
## Gauge
The **Gauge** visualization type shows a value's position in a range using a half-pie chart.
To create an example gauge **Display** block, do the following:
1. Create an **HTTP Request** block with a GET request to `techcrunch.com/wp-json/wp/v2/posts`.
2. Create and connect an **Evaluate > FQL** block to the **HTTP Request** block.
3. In the **Evaluate** block, enter the `$count(value1.body)` [FQL](/flows/flows-query-language/introduction-to-fql/) query to count how many items the response body contains.
4. Create a **Display > Gauge** block. Connect it to the **Evaluate** block.
5. Connect the **Display** block to the **Evaluate** block, then click **Run**. The gauge shows the number of items in the response body as the shaded part of the graph.
To set the minimum and maximum values for the gauge, click **Additional Settings** in the **Display** block.
**Save**.
4. Create a **Display > Line Chart** block, then connect the **List 1** and **List 2** inputs in the **Start** block to the **Display** block.
5. Click **Run** in the Flows toolbar. A line chart displays the data on their respective axes.
## Gauge
The **Gauge** visualization type shows a value's position in a range using a half-pie chart.
To create an example gauge **Display** block, do the following:
1. Create an **HTTP Request** block with a GET request to `techcrunch.com/wp-json/wp/v2/posts`.
2. Create and connect an **Evaluate > FQL** block to the **HTTP Request** block.
3. In the **Evaluate** block, enter the `$count(value1.body)` [FQL](/flows/flows-query-language/introduction-to-fql/) query to count how many items the response body contains.
4. Create a **Display > Gauge** block. Connect it to the **Evaluate** block.
5. Connect the **Display** block to the **Evaluate** block, then click **Run**. The gauge shows the number of items in the response body as the shaded part of the graph.
To set the minimum and maximum values for the gauge, click **Additional Settings** in the **Display** block.