***
title: View monitor results
approved: 2026-03-02T00:00:00.000Z
slug: docs/monitoring-your-api/viewing-monitor-results
max-toc-depth: 2
ux: v12
-------
[Monitors](/docs/monitoring-your-api/setting-up-monitor/) continuously track the health and performance of your APIs. With Postman, you can stay up to date on what's happening across all monitors in your workspace. Or you can review individual monitors to examine test results and performance over time.
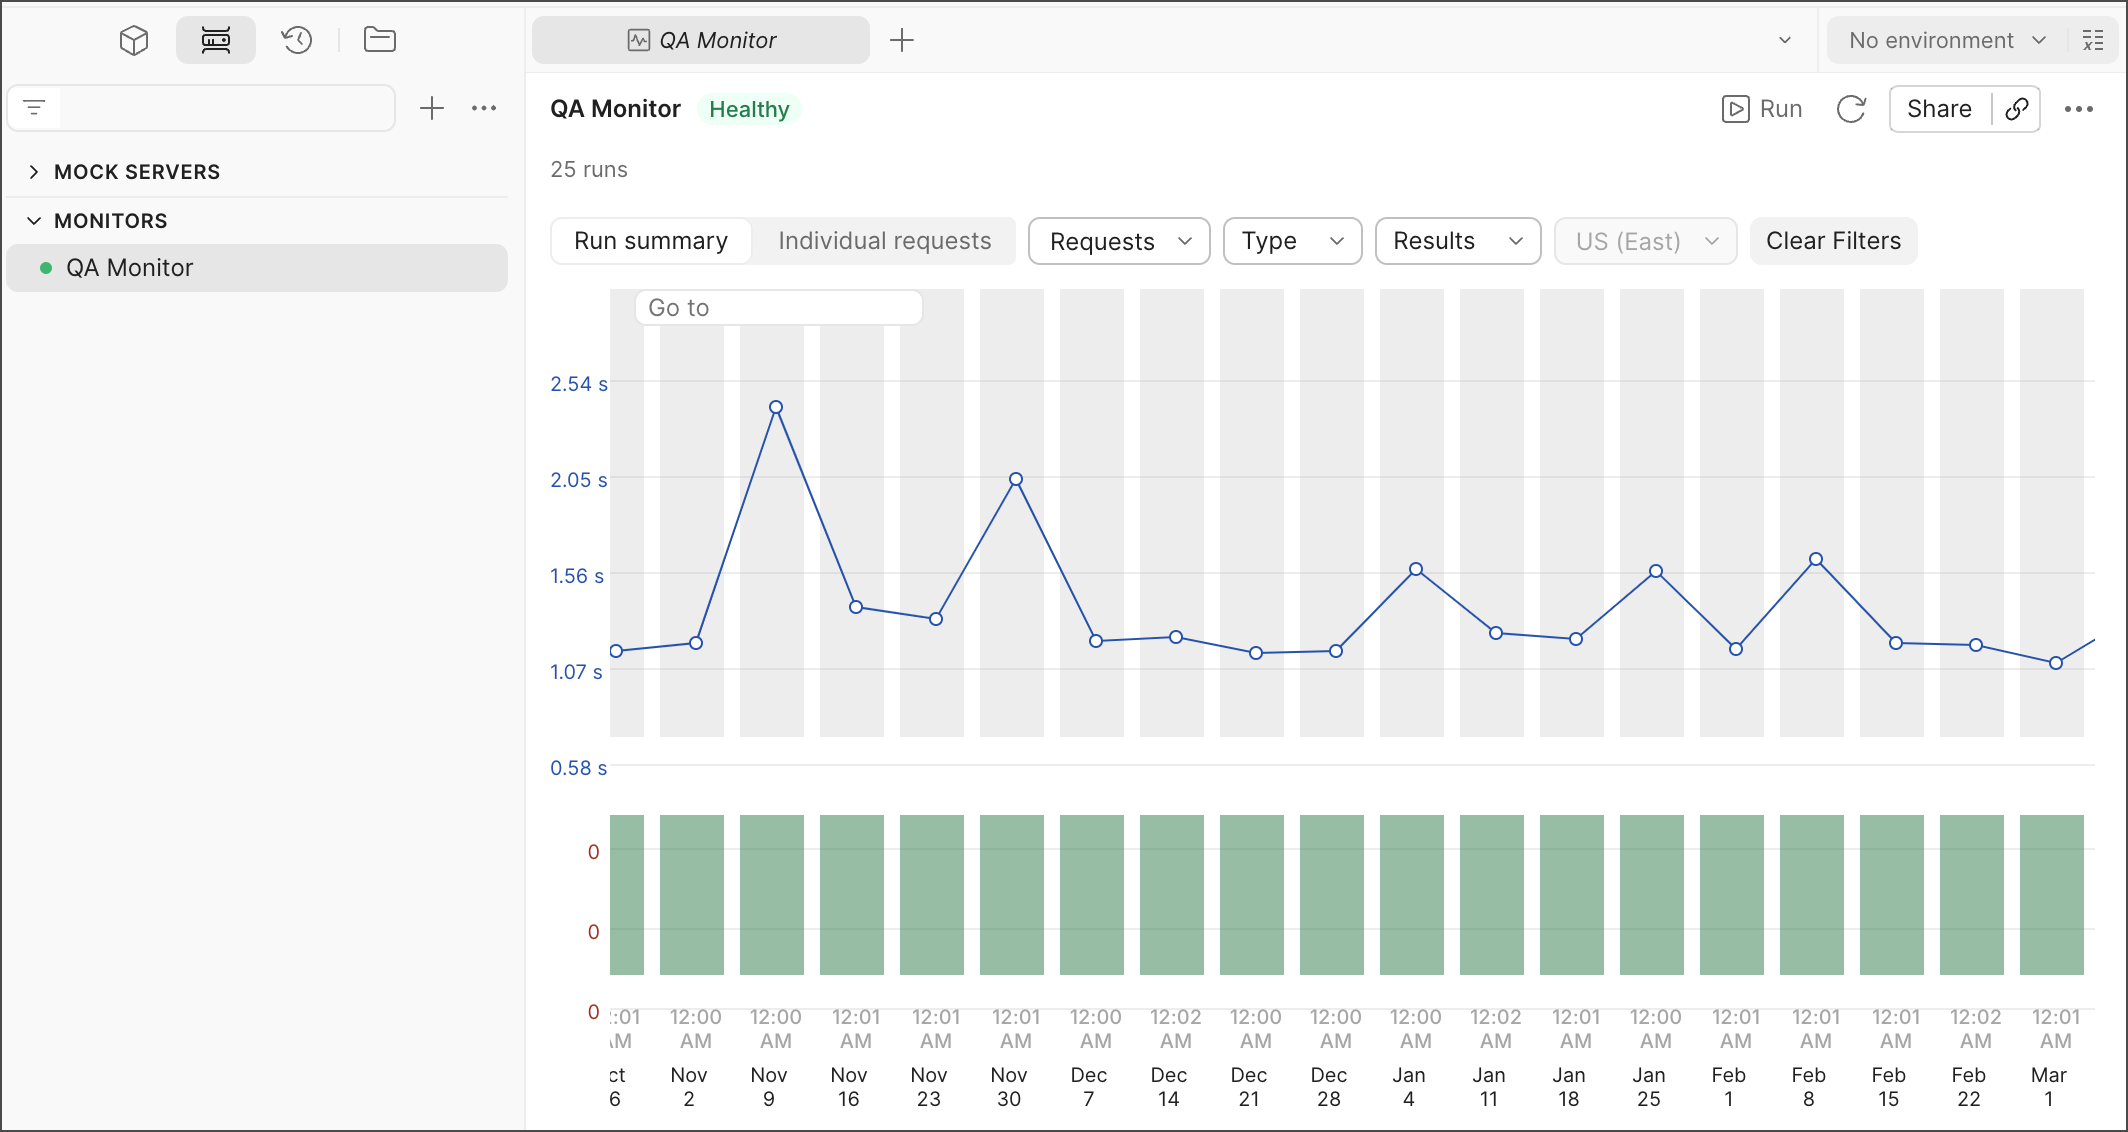
You can view your monitors in Postman by navigating to your workspace and clicking **Monitors** in the sidebar. Select your monitor to open a tab detailing its latest performance.
Monitors are visible to all members of the workspace.
## Monitor summary
You can use the monitor summary to understand how your APIs have performed over time. Each monitor run is represented by a bar in the graph. By default, this displays the monitor's **Run summary** view.
The upper section charts your monitor's average response time for each run, while the lower section visualizes the number of failed tests for each run across all regions. To view the exact values for failed percentage and response time, hover over each run individually.
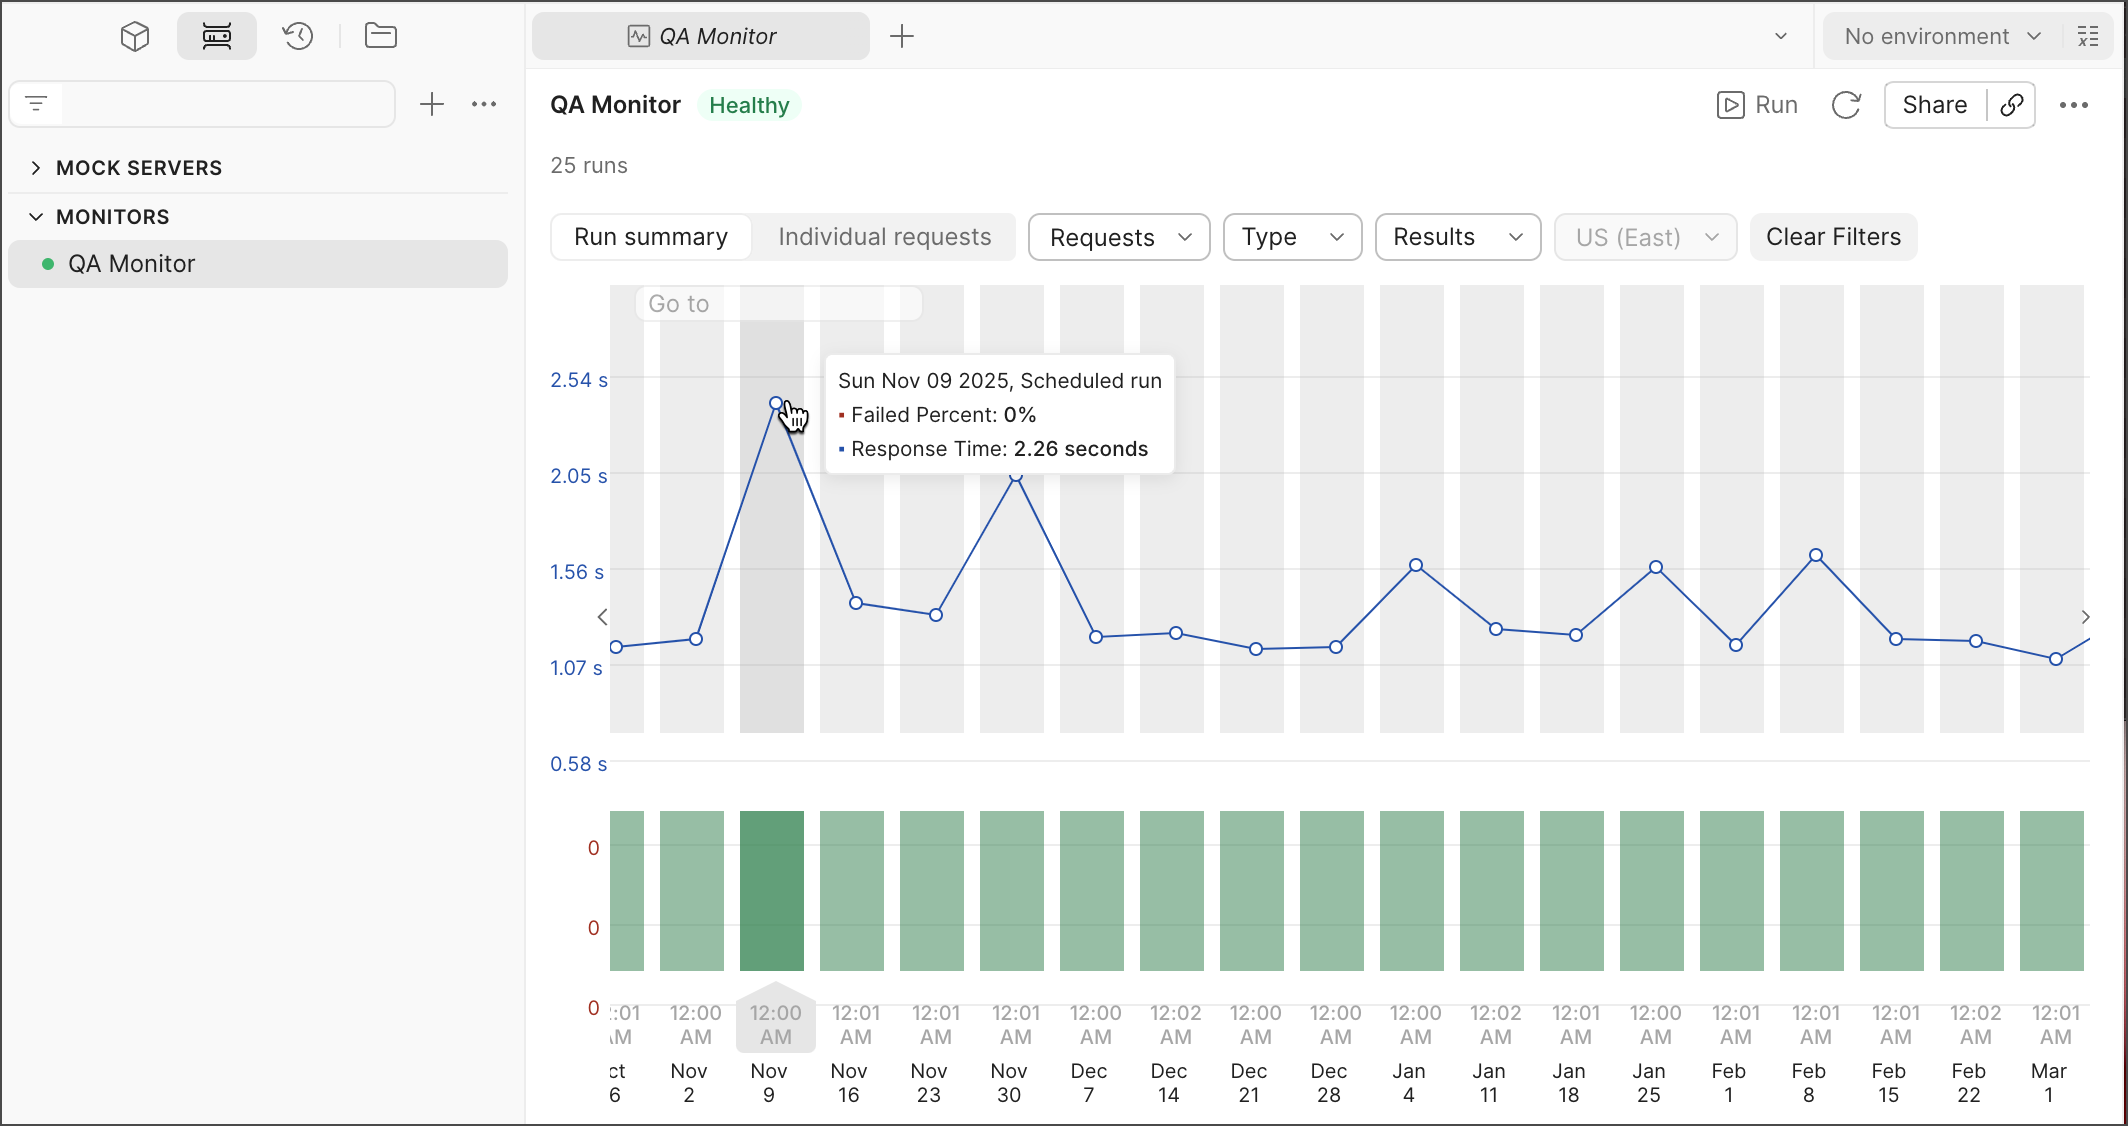
A red bar indicates that either tests failed or errors occurred during the run. For more information, view your [Console Log](/docs/monitoring-your-api/viewing-monitor-results/#console-log).
### Individual requests
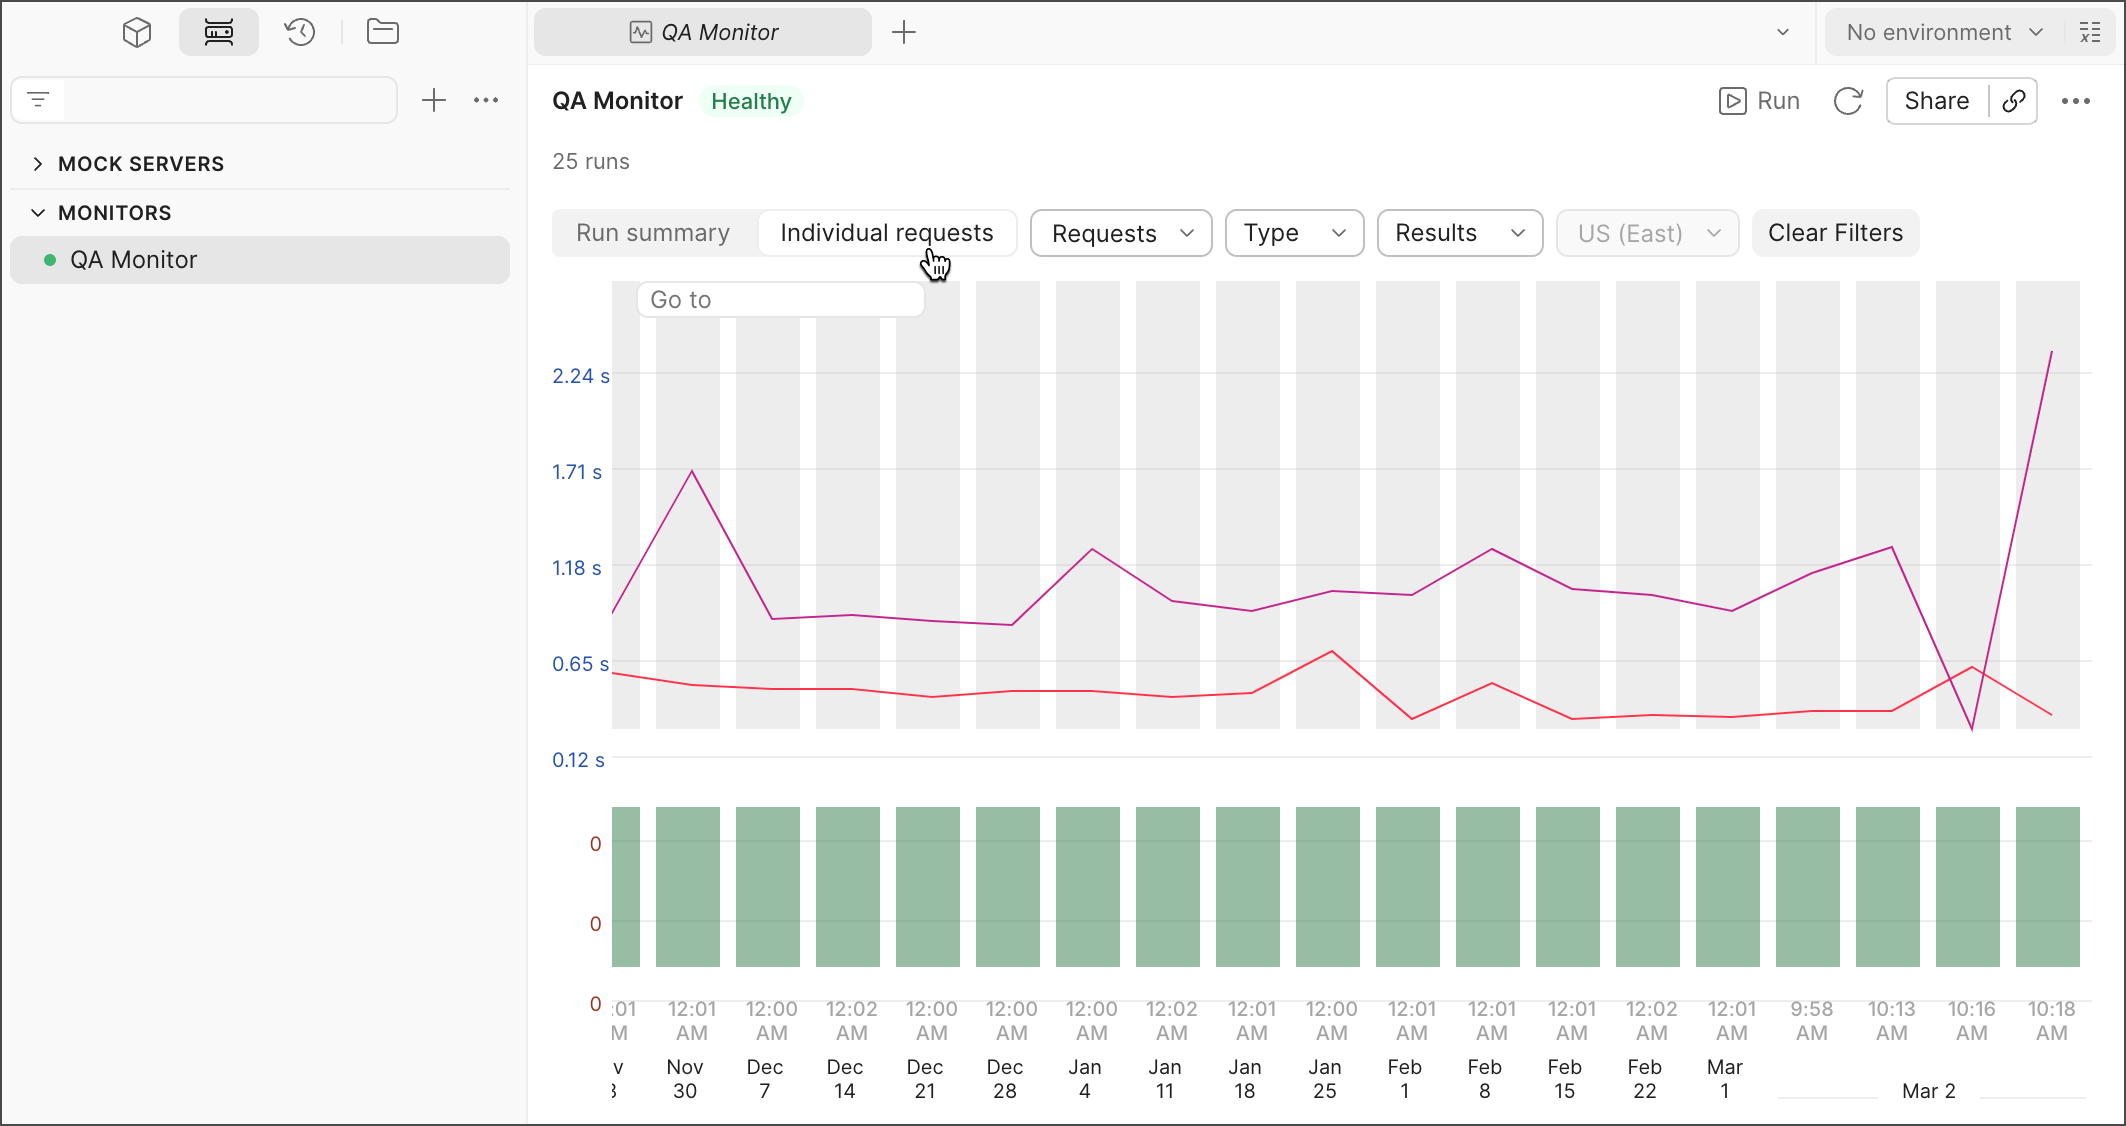
You can select **Individual requests** to break down your monitor summary into separate requests.
## Filters
You can use filters to identify recurring patterns in your monitoring runs by selecting particular requests, run types, results, and regions (if applicable). Click **Clear Filters** to return to your original dashboard view.
### Filter by request
You can filter by a specific request to compare its response time in different runs.
### Filter by type
You can filter by run type to compare how the response time changes between the type of run:
* Manual runs are initiated in Postman or are triggered by the [Postman API](https://www.postman.com/postman/postman-public-workspace/request/80oupaf/run-a-monitor).
* Scheduled runs are initiated by the schedule you set when creating or editing your monitor.
* Webhook runs are initiated by integrations you've created.
* Postman CLI runs are triggered by the [`postman monitor run` command](/docs/postman-cli/postman-cli-options/#postman-monitor-run).
Click **Clear selected** to clear the selected filters.
### Filter by run result
You can filter by run results to compare how your runs with the same result have differed. Each run is labeled based on its result:
* **Successful** — Your monitor completed the run with no issues and passed all tests.
* **Failure** — Your monitor completed the run, however one or more tests failed.
* **Error** — Your monitor was unable to complete its run due to an error. An error can occur if there is a syntax error in the code you've written, a network error, or for various other reasons. If you get an error, your [Console Log](#console-log) will help you identify what caused it.
* **Abort** — Your monitor timed out because it didn't complete its run within the allotted 10 minutes (Postman Free plans) or 15 minutes (Postman paid plans).
Click **Clear selected** to clear the selected filters.
### Filter by region or runner
You can filter by [regions or runners](/docs/monitoring-your-api/setting-up-monitor/#add-regions-and-runners) to compare API health or performance across multiple geographic regions or networks.
This feature is available if you selected multiple regions or runners when you created or last edited your monitor.
## Time traverse
You can review past run results to understand what happened at a particular point in time. To do so, click **Go to** in the upper-left corner of the monitor summary. Select the time and date, then click **Apply** to view a specific run.
To revert the view to your most recent runs, select the time and date you defined in the upper-left corner of the graph, then click **Reset**.
## Test results
Click **All Tests** to get more detailed information on your tests, including which passed or failed, the response codes, the response times, and any failed test assertions.
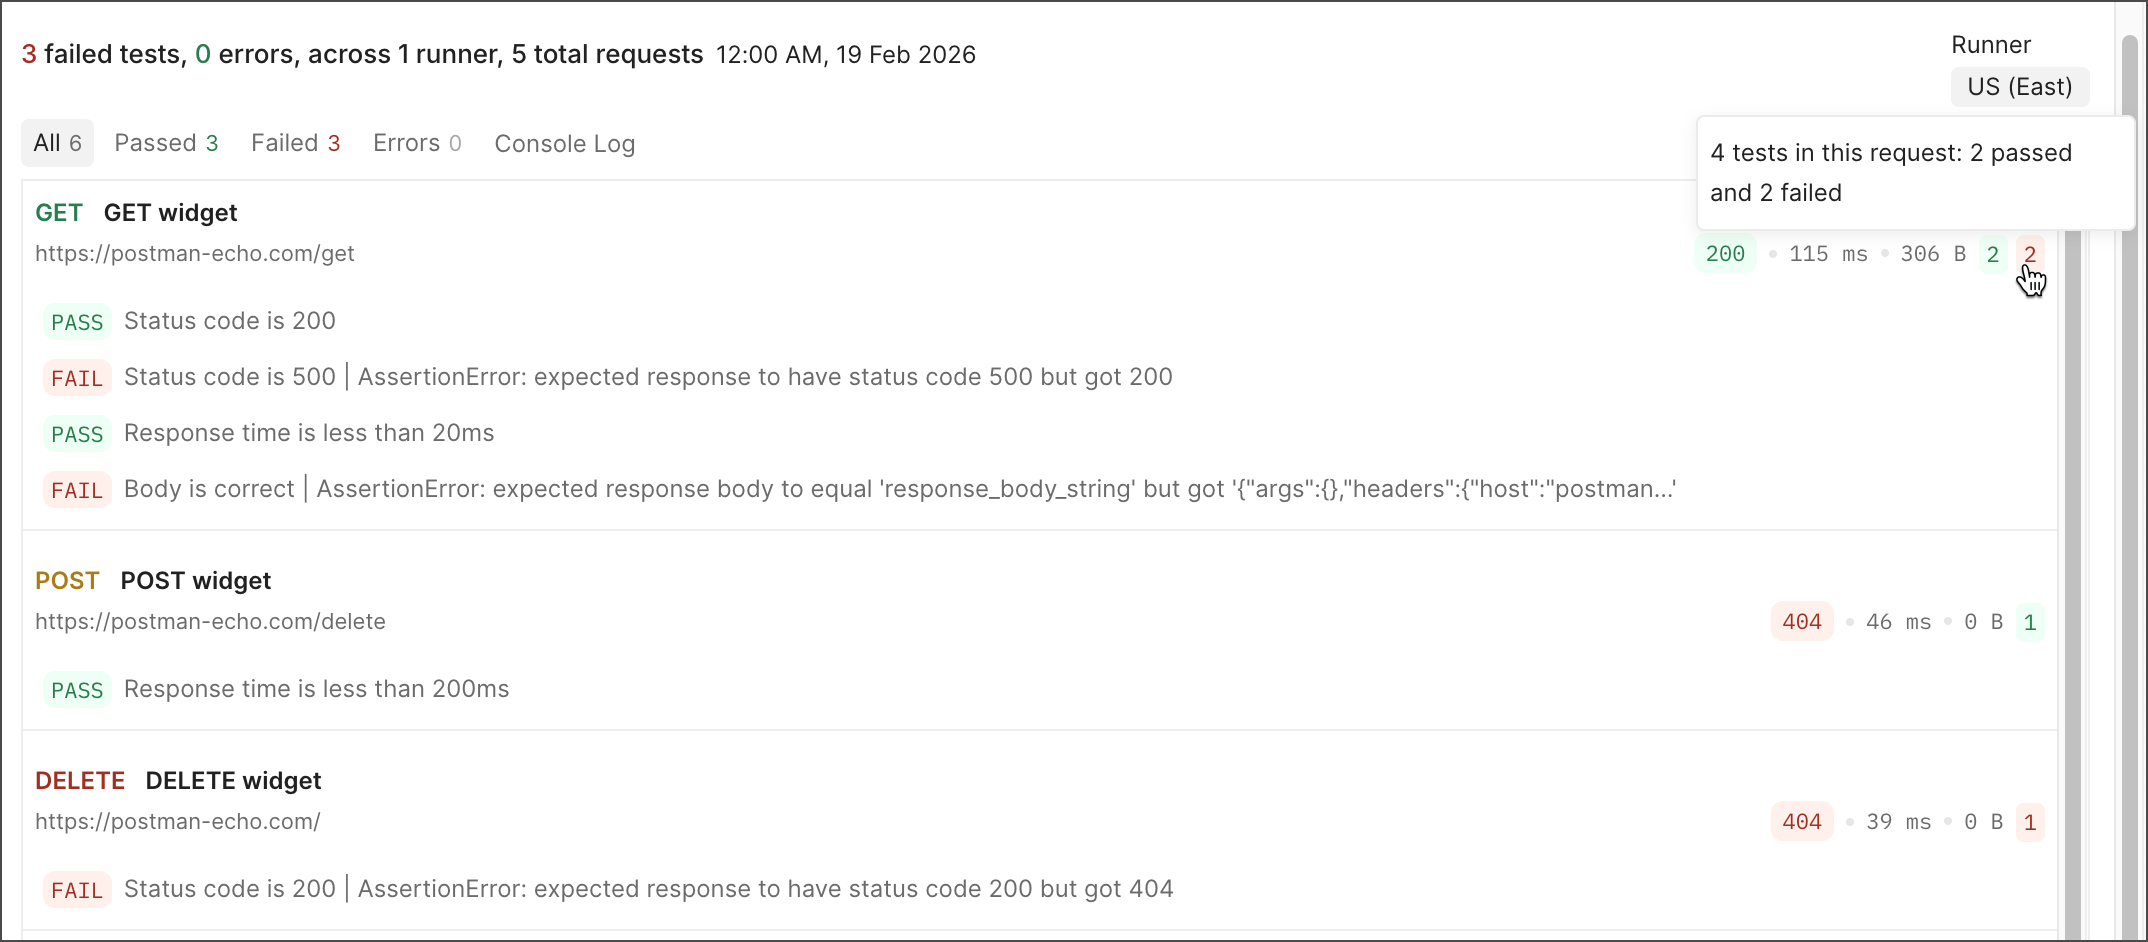
To learn more about the test results for each request, you can view the following:
* View the test results for a particular region by selecting it from the **Region** dropdown list. You can select a different region if your monitor is configured to run in multiple regions.
* Click the **All** tab to view all requests in the monitor with tests that passed or failed, including requests without any tests. Click the **Passed**, **Failed**, or **Errors** tab to only view requests with tests in that category. The number of tests in that category appears next to each tab.
* Next to each request you can view the response code, time, and size. You can also view the number of tests that passed (green) or failed (red). Hover over one of these numbers to view a detailed breakdown of the tests in the request.
* Click a request to view which tests passed or failed.
* Click the name of a request to open the request in a new tab.
* If your requests are in a folder, click the name of the folder to open it in a new tab.
If any of your requests encounter a failure or error, you can click  **Debug with AI** to use [Postman Agent Mode](/docs/agent-mode/overview/) to help you debug and fix them.
## Errors
Click the **Errors** tab to filter results by requests that encountered errors. Errors indicate runtime issues like timeout or TLS handshake errors. Failed requests occur when one or more user-specified checks (like post-request scripts) don't match expectations.
The requests in your collection run that have errors appear in the run results page with an error badge and the error message. Badges identify errors as related to network, request, or script issues.
## Console log
Click the **Console Log** tab to view and search monitor run details along with the [`console.log`](/docs/sending-requests/response-data/troubleshooting-api-requests/) statements that run as part of your pre-request and post-response scripts in the Postman Console. Run details specify the various stages of a monitor run such as preparing run, running, rerunning ([if applicable](/docs/monitoring-your-api/setting-up-monitor/#use-retry-on-failure)), and the run result, along with error and test failure information. Clicking a request in the console log opens it in a tab, allowing you to review and edit the request as needed.
If your monitor is configured to run in multiple regions, you can select a different region in the **Runner** menu.
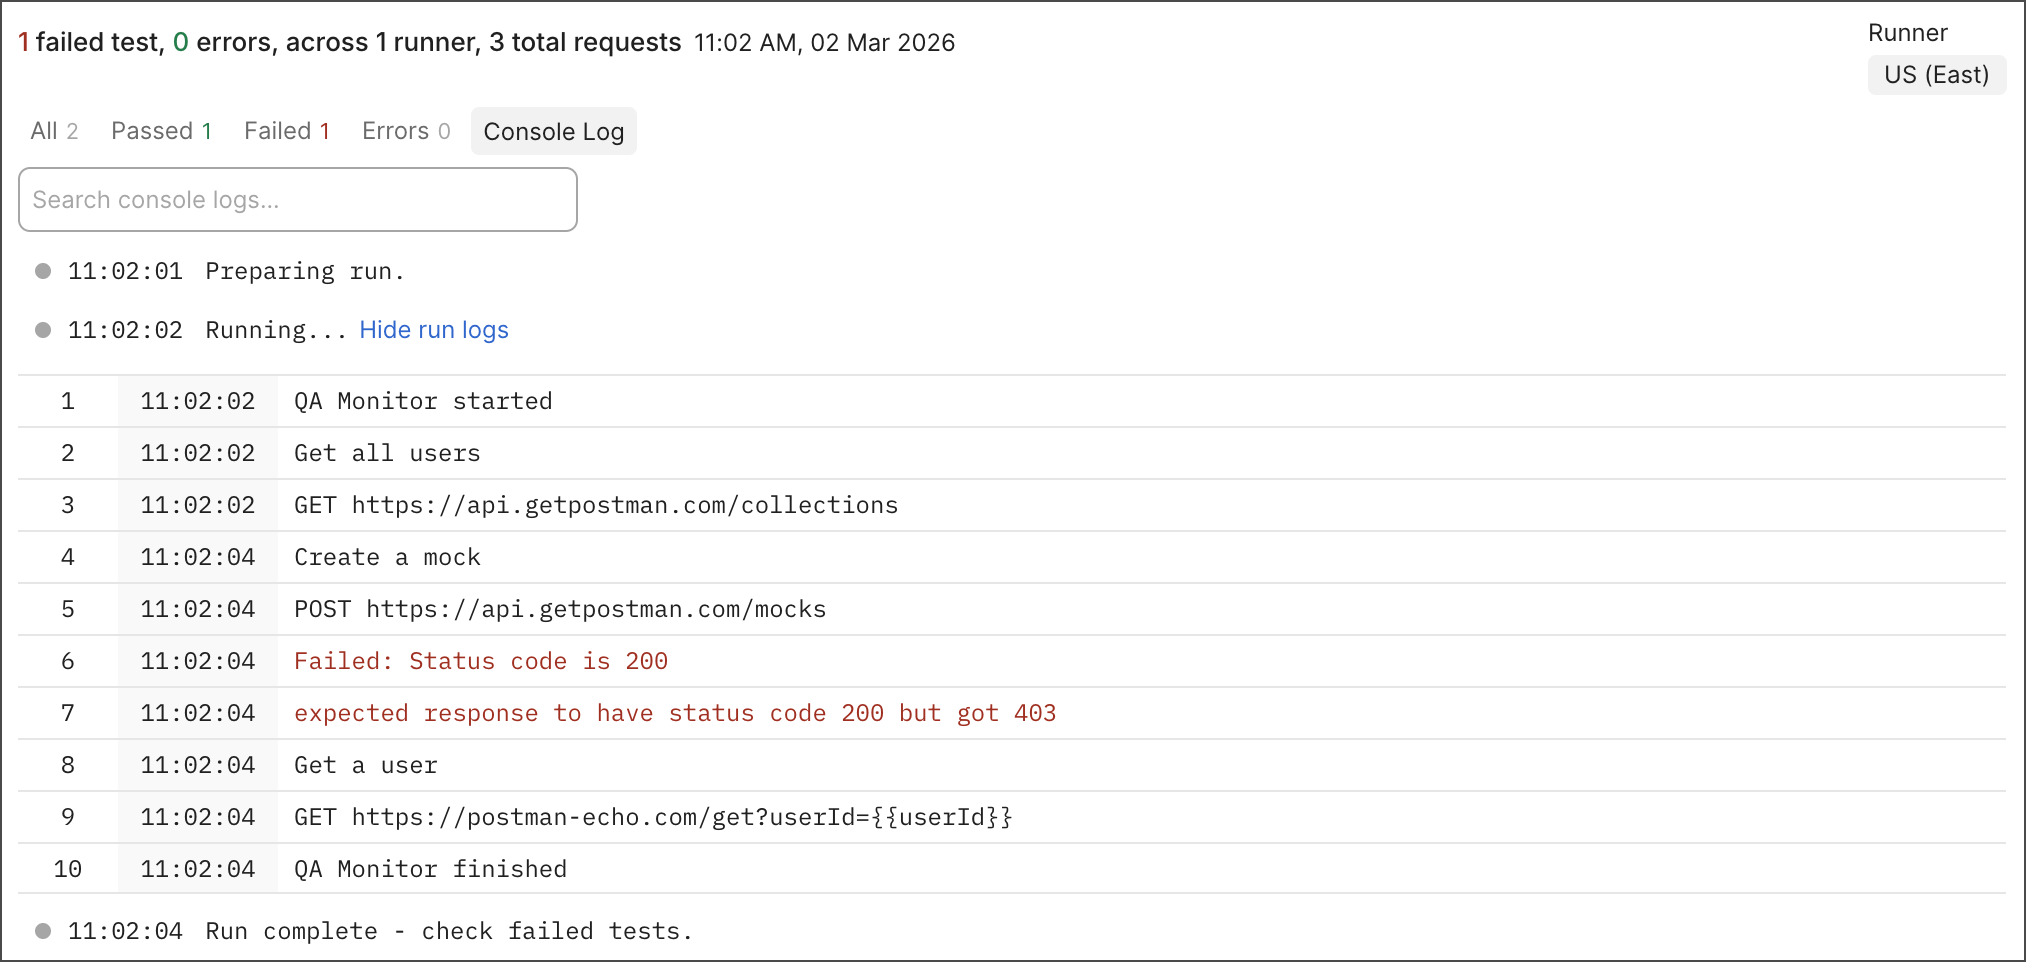
You can use the Console to both troubleshoot issues and learn more about an individual run's behavior.
Find specific strings with the Console log's search feature. Searching enables you to highlight and cycle through error messages and codes automatically instead of scanning the log manually.
Matches are highlighted in the log, and you can click
**Debug with AI** to use [Postman Agent Mode](/docs/agent-mode/overview/) to help you debug and fix them.
## Errors
Click the **Errors** tab to filter results by requests that encountered errors. Errors indicate runtime issues like timeout or TLS handshake errors. Failed requests occur when one or more user-specified checks (like post-request scripts) don't match expectations.
The requests in your collection run that have errors appear in the run results page with an error badge and the error message. Badges identify errors as related to network, request, or script issues.
## Console log
Click the **Console Log** tab to view and search monitor run details along with the [`console.log`](/docs/sending-requests/response-data/troubleshooting-api-requests/) statements that run as part of your pre-request and post-response scripts in the Postman Console. Run details specify the various stages of a monitor run such as preparing run, running, rerunning ([if applicable](/docs/monitoring-your-api/setting-up-monitor/#use-retry-on-failure)), and the run result, along with error and test failure information. Clicking a request in the console log opens it in a tab, allowing you to review and edit the request as needed.
If your monitor is configured to run in multiple regions, you can select a different region in the **Runner** menu.

You can use the Console to both troubleshoot issues and learn more about an individual run's behavior.
Find specific strings with the Console log's search feature. Searching enables you to highlight and cycle through error messages and codes automatically instead of scanning the log manually.
Matches are highlighted in the log, and you can click  **Next match** and
  **Previous match** to cycle through them. Click
  **Clear search** to clear the search field and results.
**Monitor run logs are retained for a period of six months.** If you select a monitor run that's outside the retention period, you can view the number of failed tests and errors. Other monitor run details will no longer be available. To request this information, contact [Postman support](https://www.postman.com/support/).
## Monitor history
You can view a monitor's history by clicking
**Clear search** to clear the search field and results.
**Monitor run logs are retained for a period of six months.** If you select a monitor run that's outside the retention period, you can view the number of failed tests and errors. Other monitor run details will no longer be available. To request this information, contact [Postman support](https://www.postman.com/support/).
## Monitor history
You can view a monitor's history by clicking  **History** in the sidebar.
You can check these logs to learn when a monitor was created, edited, paused, or resumed running, and which team member performed each action.
## Monitor details
You can view details about a monitor by clicking the information icon
**History** in the sidebar.
You can check these logs to learn when a monitor was created, edited, paused, or resumed running, and which team member performed each action.
## Monitor details
You can view details about a monitor by clicking the information icon  in the right sidebar. You can view a monitor's ID, creator, creation date and time, collection, environment, and integration options.
## Troubleshooting
Learn how to [troubleshoot your monitors](/docs/monitoring-your-api/troubleshooting-monitors/) and check out [Postman monitoring FAQs](/docs/monitoring-your-api/faqs-monitors/).
in the right sidebar. You can view a monitor's ID, creator, creation date and time, collection, environment, and integration options.
## Troubleshooting
Learn how to [troubleshoot your monitors](/docs/monitoring-your-api/troubleshooting-monitors/) and check out [Postman monitoring FAQs](/docs/monitoring-your-api/faqs-monitors/).