***
title: Check flow health and run history
approved: 2026-03-01T00:00:00.000Z
topictype: procedure
slug: docs/postman-flows/build-flows/analyze/analytics
max-toc-depth: 2
ux: v12 but needs updated screenshot
------------------------------------
The **Analytics** tab in Postman Flows provides details about how flows in the Postman Cloud are performing. Use the **Analytics** tab to monitor when, how often, and how long flows run in the cloud, and whether they succeed or fail. In the displayed run logs, you can open any individual block and view its success/failure status, data input and output, and further details.
To see the **Analytics** tab in Postman Flows, do the following:
1. Open a workspace and click **Flows >  More actions > View analytics**.
You can also open the Analytics tab from the [**Deploy**](/docs/postman-flows/build-flows/structure/actions/) dialog.
2. Select a time range from the dropdown list to display runs from that time. You can filter the list of runs by run ID, flow name, status, and trigger type.
You can get the run ID from the response's `x-session-id` header.
3. Click a run in the list to open the **Run Details** pane.
4. After a flow completes its run, the **Run Details** pane shows each block's status (
More actions > View analytics**.
You can also open the Analytics tab from the [**Deploy**](/docs/postman-flows/build-flows/structure/actions/) dialog.
2. Select a time range from the dropdown list to display runs from that time. You can filter the list of runs by run ID, flow name, status, and trigger type.
You can get the run ID from the response's `x-session-id` header.
3. Click a run in the list to open the **Run Details** pane.
4. After a flow completes its run, the **Run Details** pane shows each block's status ( **Success** or
  **Fail**). Click the **Run Logs** dropdown lists to filter by block and status.
{/*TODO: Update screenshot. Flows are not deploying on beta. TW-3664
**Fail**). Click the **Run Logs** dropdown lists to filter by block and status.
{/*TODO: Update screenshot. Flows are not deploying on beta. TW-3664
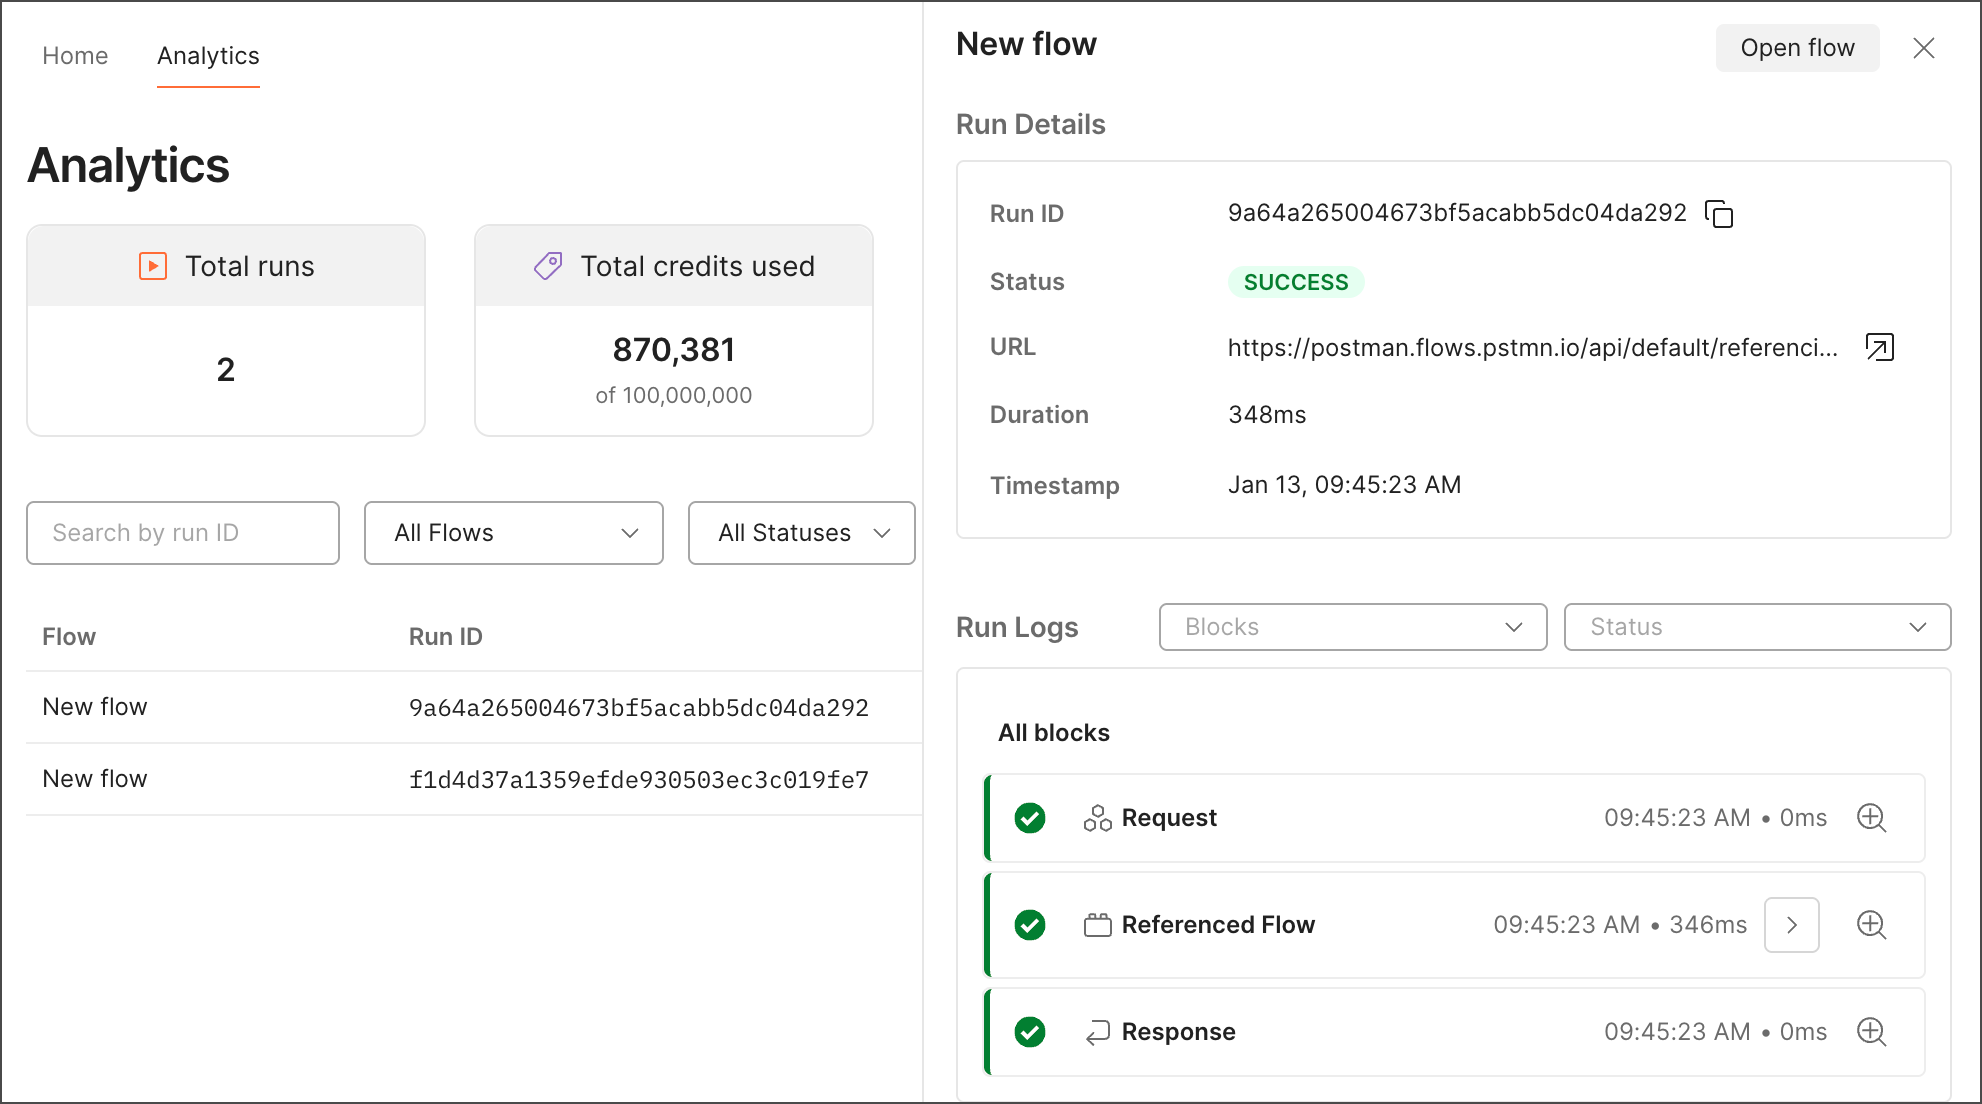 */}
5. Select a block from the list to see its input, output, and details.
6. If your flow uses [**Flow** blocks](/docs/postman-flows/reference/blocks/flow-module/), click
*/}
5. Select a block from the list to see its input, output, and details.
6. If your flow uses [**Flow** blocks](/docs/postman-flows/reference/blocks/flow-module/), click  **View module blocks** next to the **Flow** block's name to view the input, output, and details for its constituent blocks.