With the Tests vs VU view, you can view how your test assertions behave as load increases. This enables you to understand whether your API remains correct under stress. By mapping test assertion results against virtual user (VU) levels, you can identify when business logic begins to degrade, which test assertions fail first, and how stability changes as the number of concurrent VUs increases.
View test assertions by virtual user load
To view test assertions by virtual user load, do the following:
- In the left sidebar, click
 Items then click a collection to view its performance test results.
 - Click Runs, then click the Performance tab to view performance test runs for the collection.
- Click the performance test run you want to view.
- Click the Tests tab.
- Click the Tests vs VU tab.
The Tests vs VU view displays a heatmap of test assertions against the number of virtual users applied during the run. Each cell in the heatmap represents the outcome of a specific test assertion at a given VU level, enabling you to identify patterns of failure or degradation as load increases.
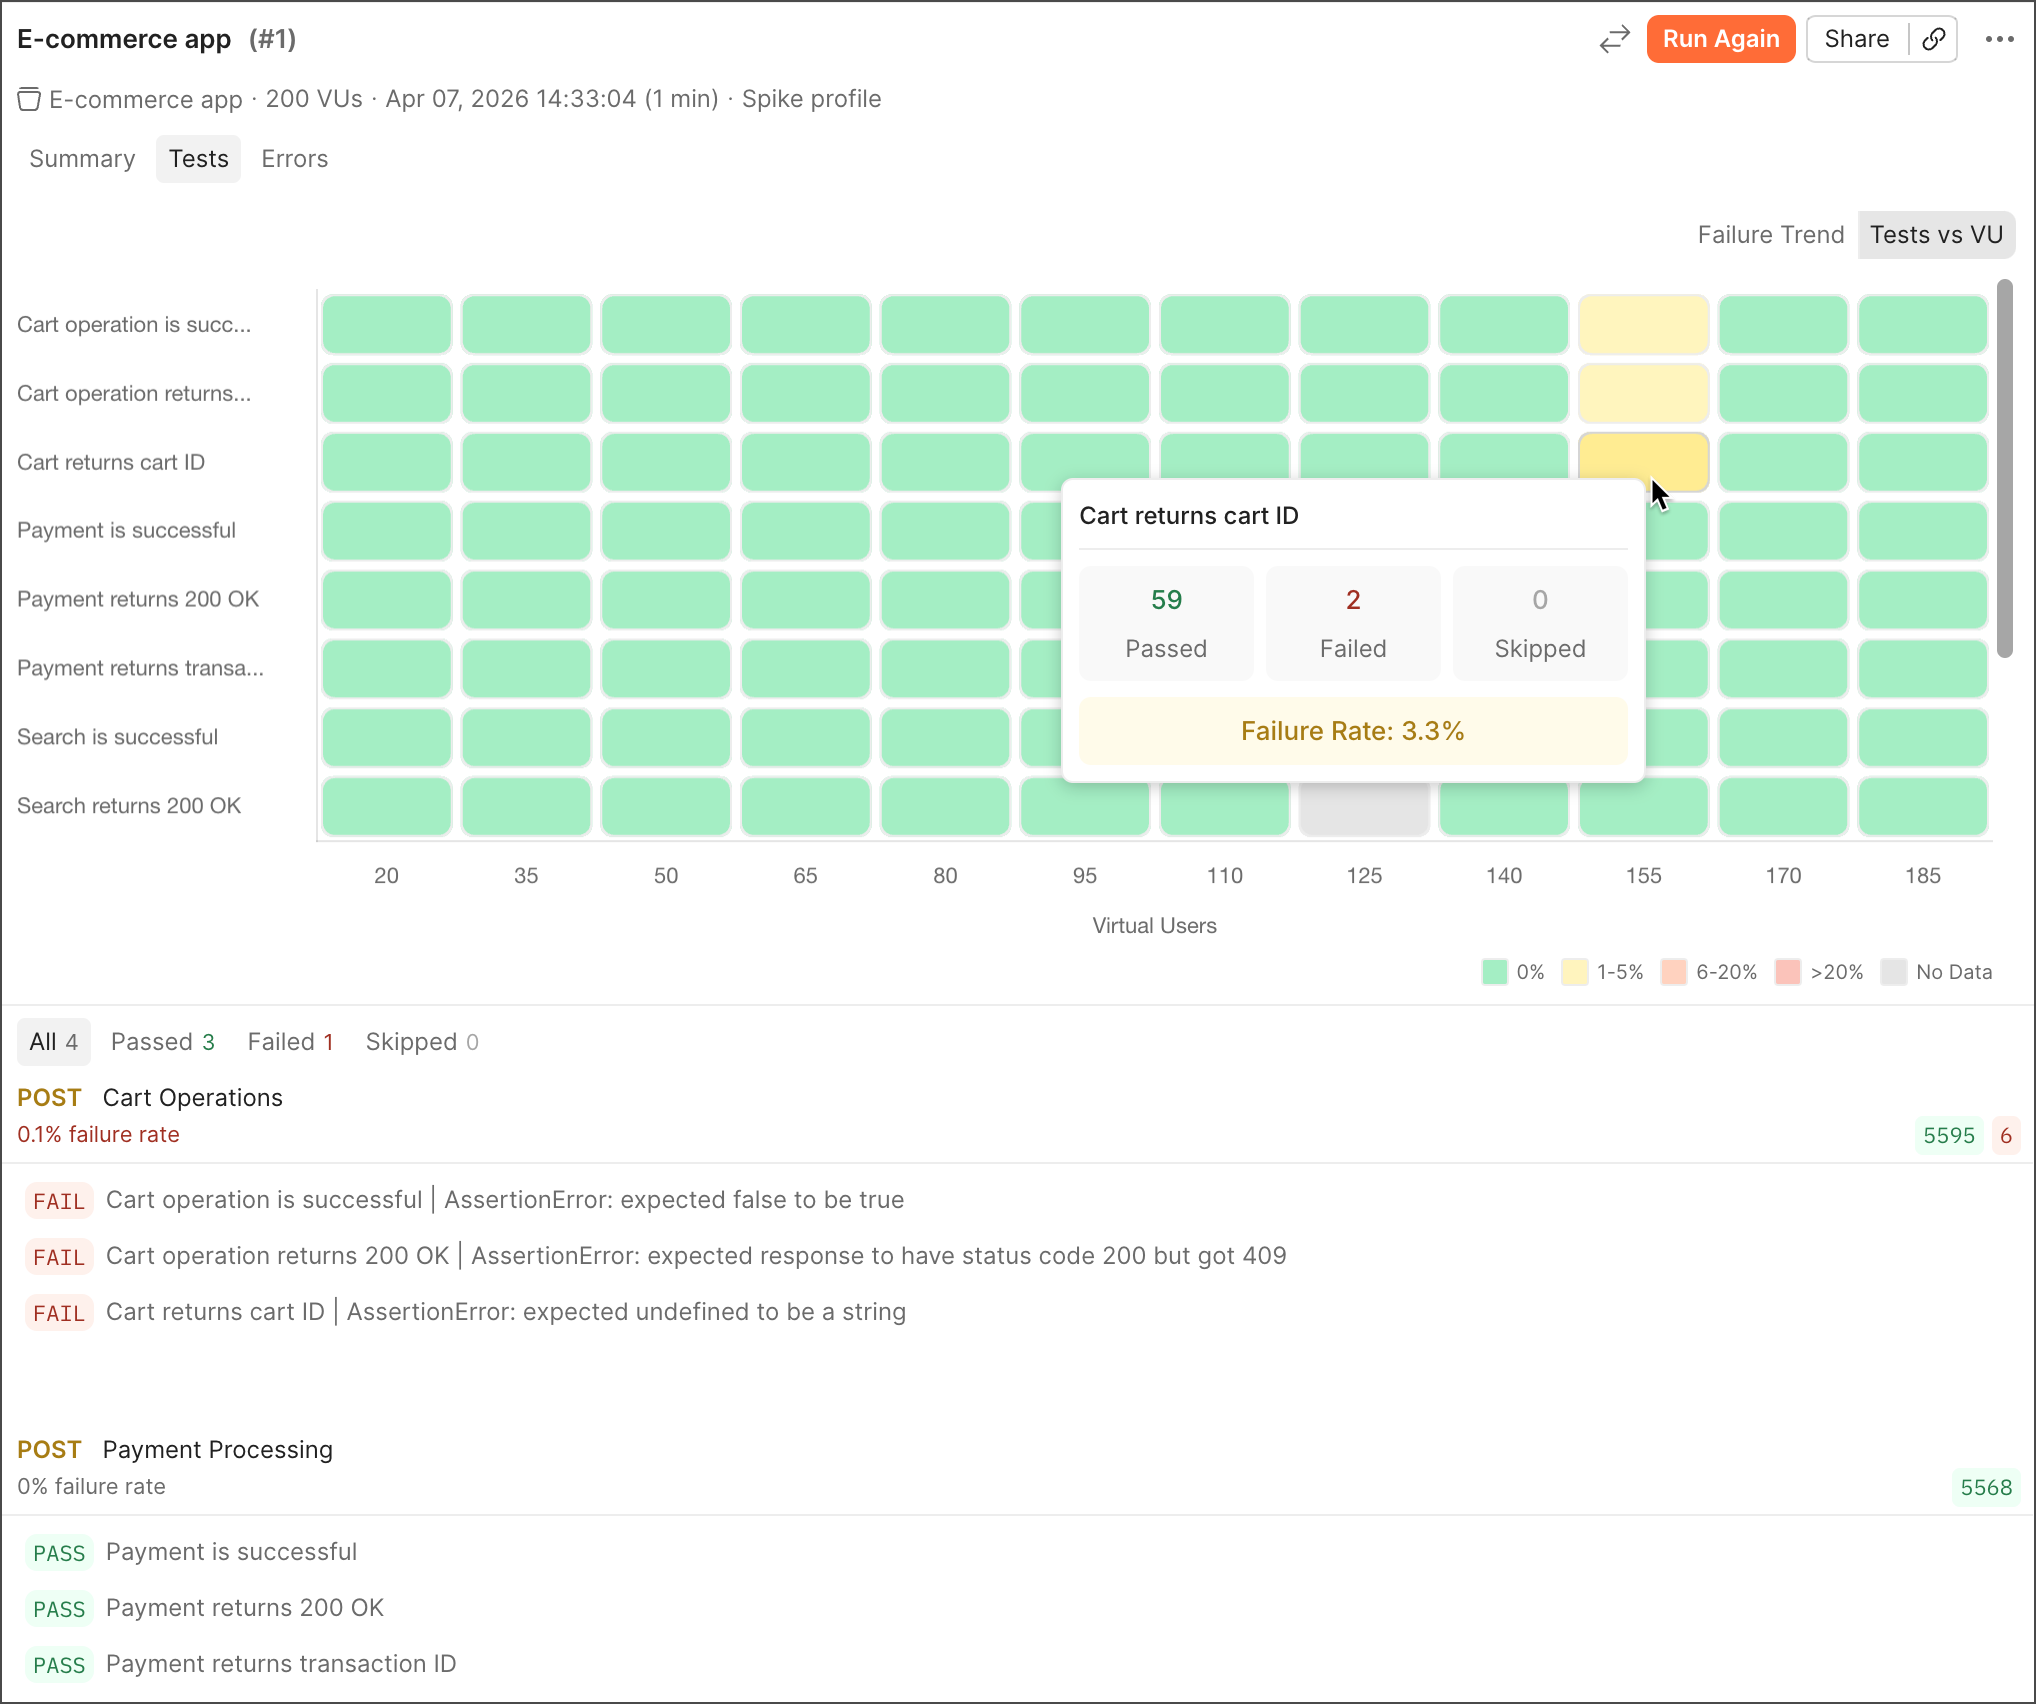
The following table explains the color coding used in the Tests vs VU heatmap:
Debug failed test assertions
Use the Tests vs VU heatmap to identify where failures occur under load, and the table below it enables you to view request-level details behind those failures.
Inspect failures in the heatmap
Hover over any cell in the heatmap to view detailed metrics for a specific test assertions at a specific VU range. This displays the test name, number of tests (passed, failed, skipped), and the failure rate.
Use this to understand how a single test assertion behaves as load increases and identify the VU range where failures begin.
View request-level details
Click any cell in the heatmap to view request-level details for the selected test assertion at that VU level. This includes the specific requests that failed (HTTP method and request name), their failure rate, and the test assertions that passed, failed, or skipped.
Analyzing these details enables you to understand how individual requests contribute to overall test assertion failures under load.
Click any folder or request in the breadcrumb path to open it in a new tab. Jump directly from a failed test assertion to the request, enabling you to investigate the issue.
Identify failure patterns
Use the heatmap to understand how your test assertions behave as the number of virtual users increases.
-
Load-sensitive failures - Find any assertions that are green (0% failure rate) at low VU levels but turn yellow, orange, or red as load increases. This pattern indicates the test assertion is sensitive to load and the related endpoint may begin to degrade as more users run at the same time.
-
Consistent failures - If an assertion is red (20%+ failure rate) across all VU ranges, it fails regardless of load. This may point to an issue with the test itself or a consistently failing endpoint, rather than a performance-related issue.
-
Intermittent issues - Assertions with a mix of green (0% failure rate) and yellow (1-5% failure rate) across VU ranges may indicate intermittent or unreliable behavior. These failures aren’t strongly tied to load and may occur unpredictably.
Postman recommends focusing on assertions that shift from green to red at relatively low VU levels. These represent the earliest failure points in your system and are the highest-priority areas to fix.