View test assertion failure trends in performance tests
After a performance test completes, you can analyze how your test assertions behaved under load. In the Tests tab, you can use the Failure Trend view to understand not just which requests failed, but when those failures occurred during the run. Use this information to identify why your API isn’t behaving as expected under load and possible causes.
View failed test assertions
You can view when requests and test assertions failed over the duration of the performance test.
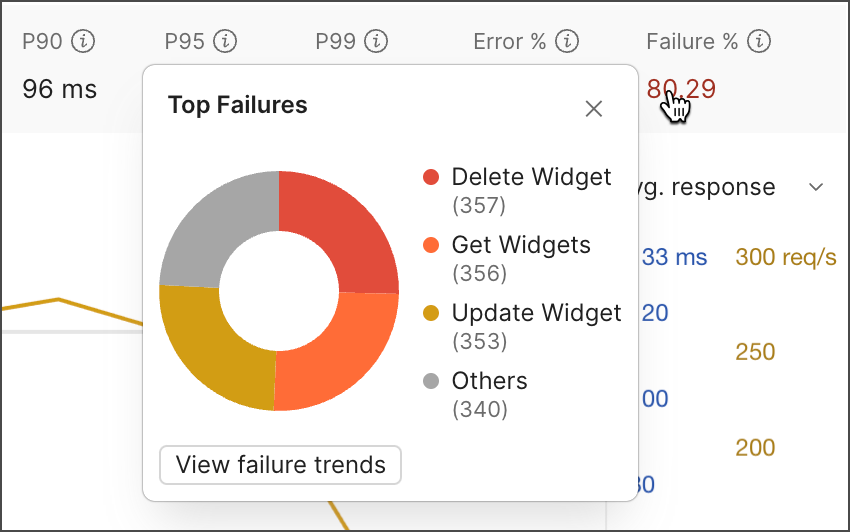
On the Summary tab, you can click Failure % to view the top requests with failed test assertions that ran during the performance test. You can click View failure trends to open a time-based view of how failures occurred throughout the run.
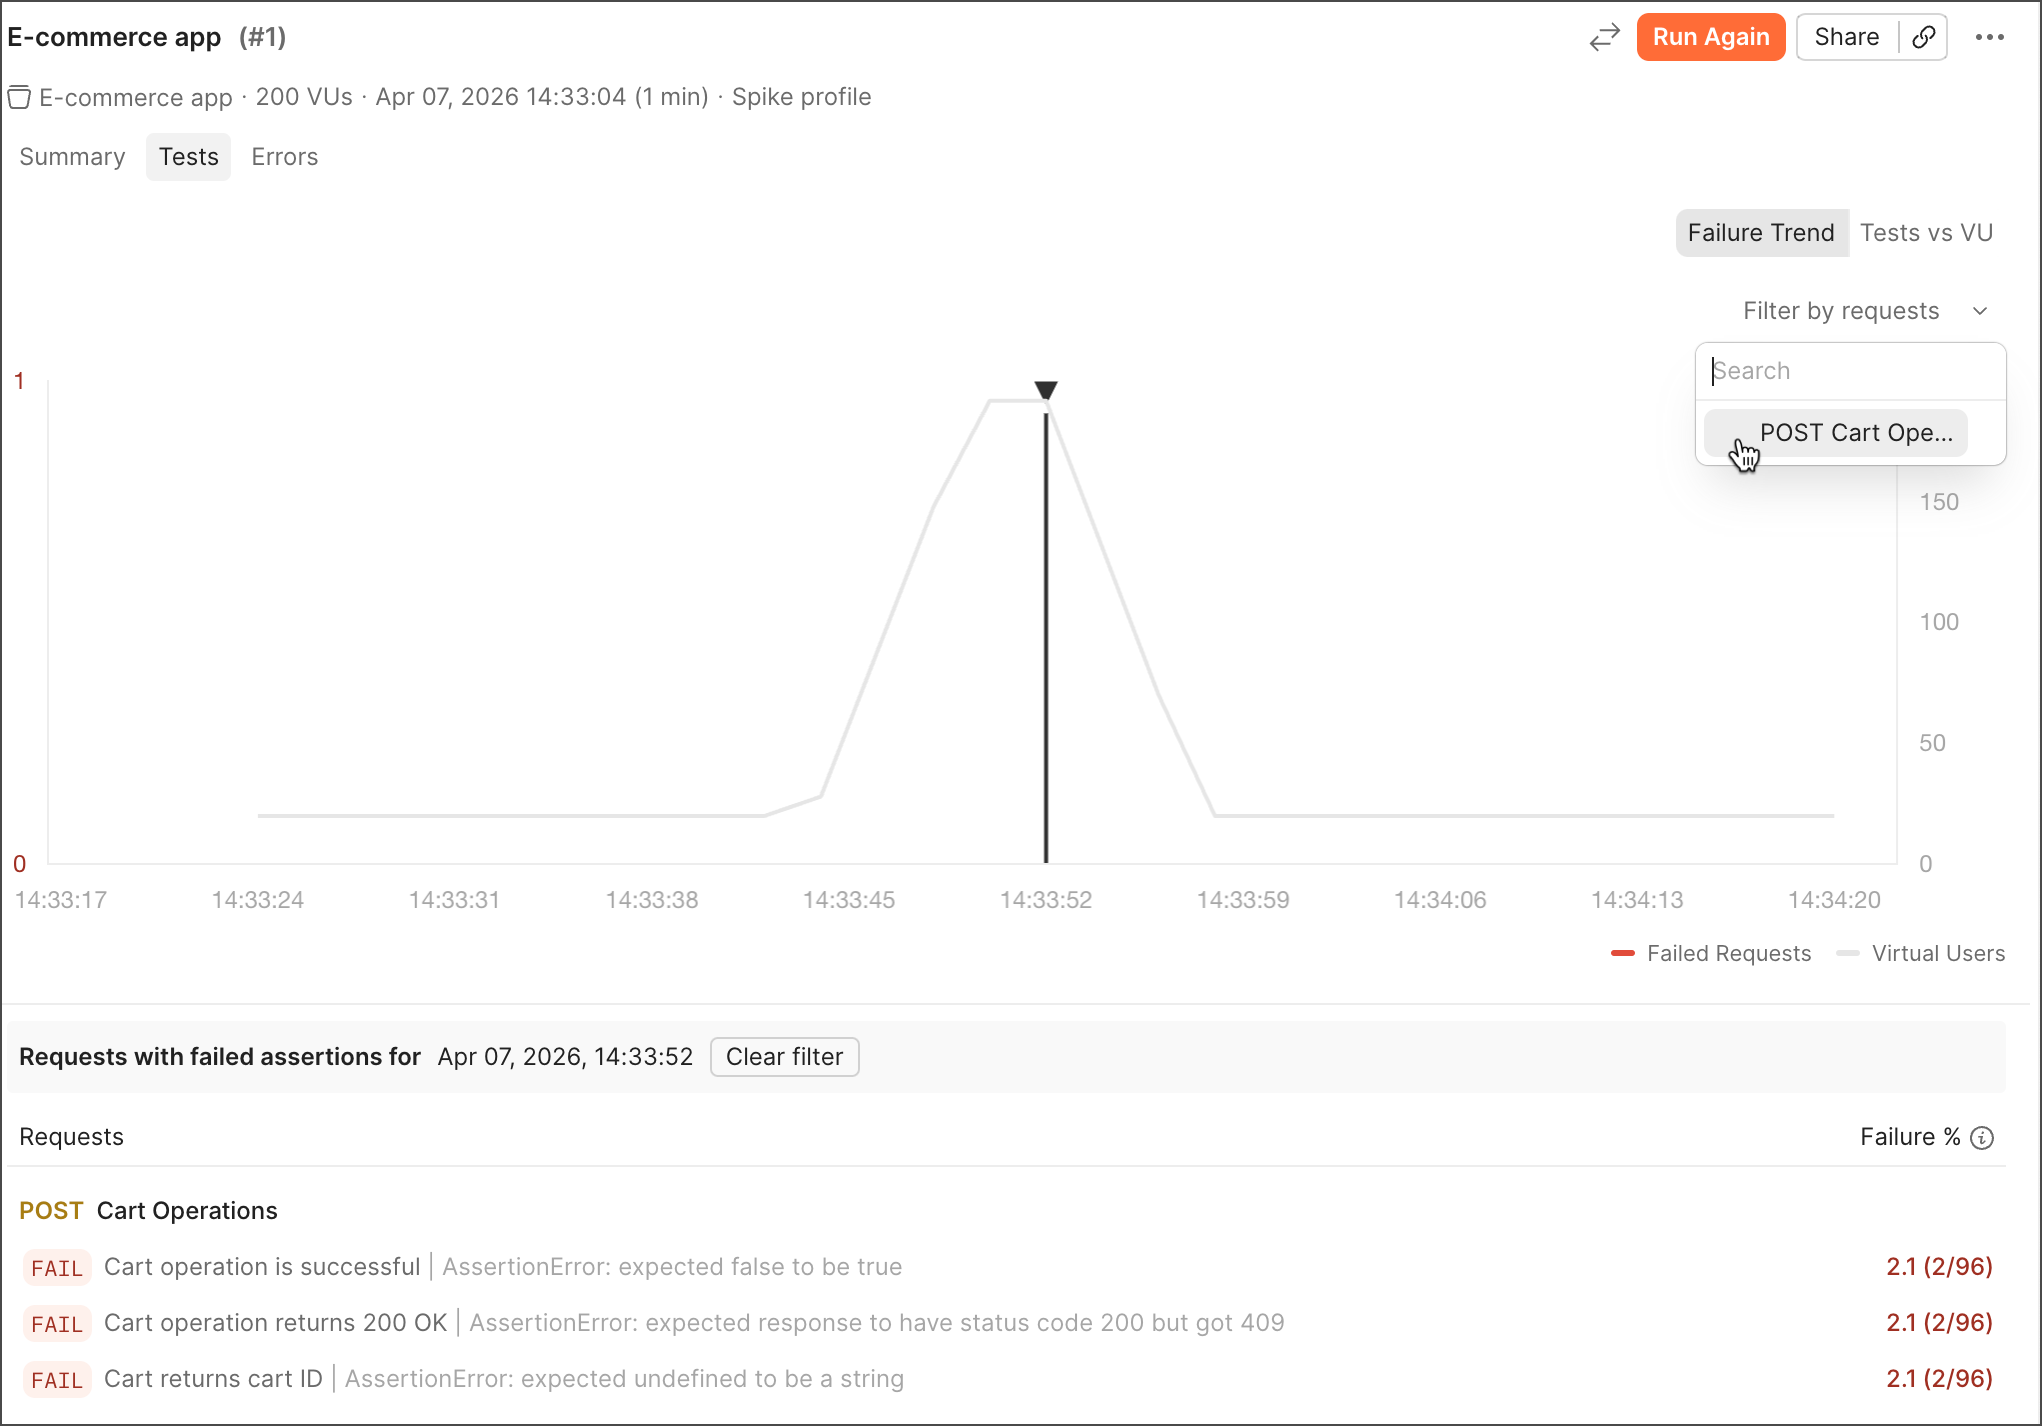
You can also open the Tests tab and click Failure Trend to analyze failures over time. In this view, you can see how test assertion failures evolve throughout the run, helping you identify when issues begin to appear.
In the table, you can view the requests that ran during the test and each failed test assertion. Next to each test assertion, you can view how often it failed relative to all requests in the run. Learn more about debugging failed test assertions.
Debug failed test assertions
In the Failure Trend view, you can analyze how test assertion failures change over time during the performance test. This is useful for identifying when failures start, whether they correlate with increased traffic, and how they evolve during the test.
- Hover over a point on the graph to view the timestamp, number of failed requests, number of virtual users, and top failed requests.
- Click a point on the graph to filter the table to that point in time and inspect the failing requests and assertions. Click Clear filter to return to the default view.
- Click the Filter by requests dropdown list to filter the results by a specific request. Click Reset to return to the default view.