View error details for performance tests
During a performance test, requests are tracked as errors if they result in a runtime error that isn’t handled by your pre-request or post-response scripts. For example, a DNS or TLS failure may stop the request before any headers are returned. You can view details about the top errors that occurred during the test and error trends over time. Use this information to gain insight into when errors are occurring and the possible causes.
View top errors
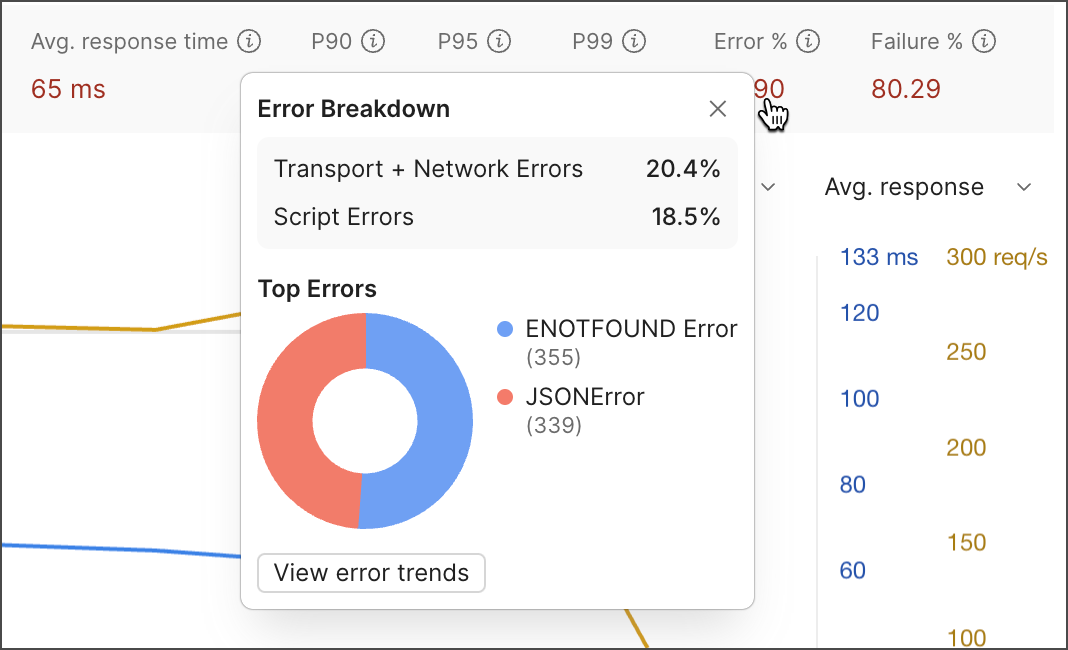
You can view a breakdown of errors and top errors on the Summary tab while the performance test is running or after the test completes. Errors indicate runtime issues such as timeouts, connection or TLS failures, or uncaught exceptions in user scripts.
Click the Error % above the graph to view a breakdown of errors and the top errors for the entire test.
View error trends
You can view error trends after the performance test completes. The error trend shows the top five errors that occurred during the test and the frequency of those errors over time. This information can help you understand how error rates change in response to increased load on your API.
To view error trends, select the Errors tab. You can also click Error % on the Summary tab, then click View error trends.
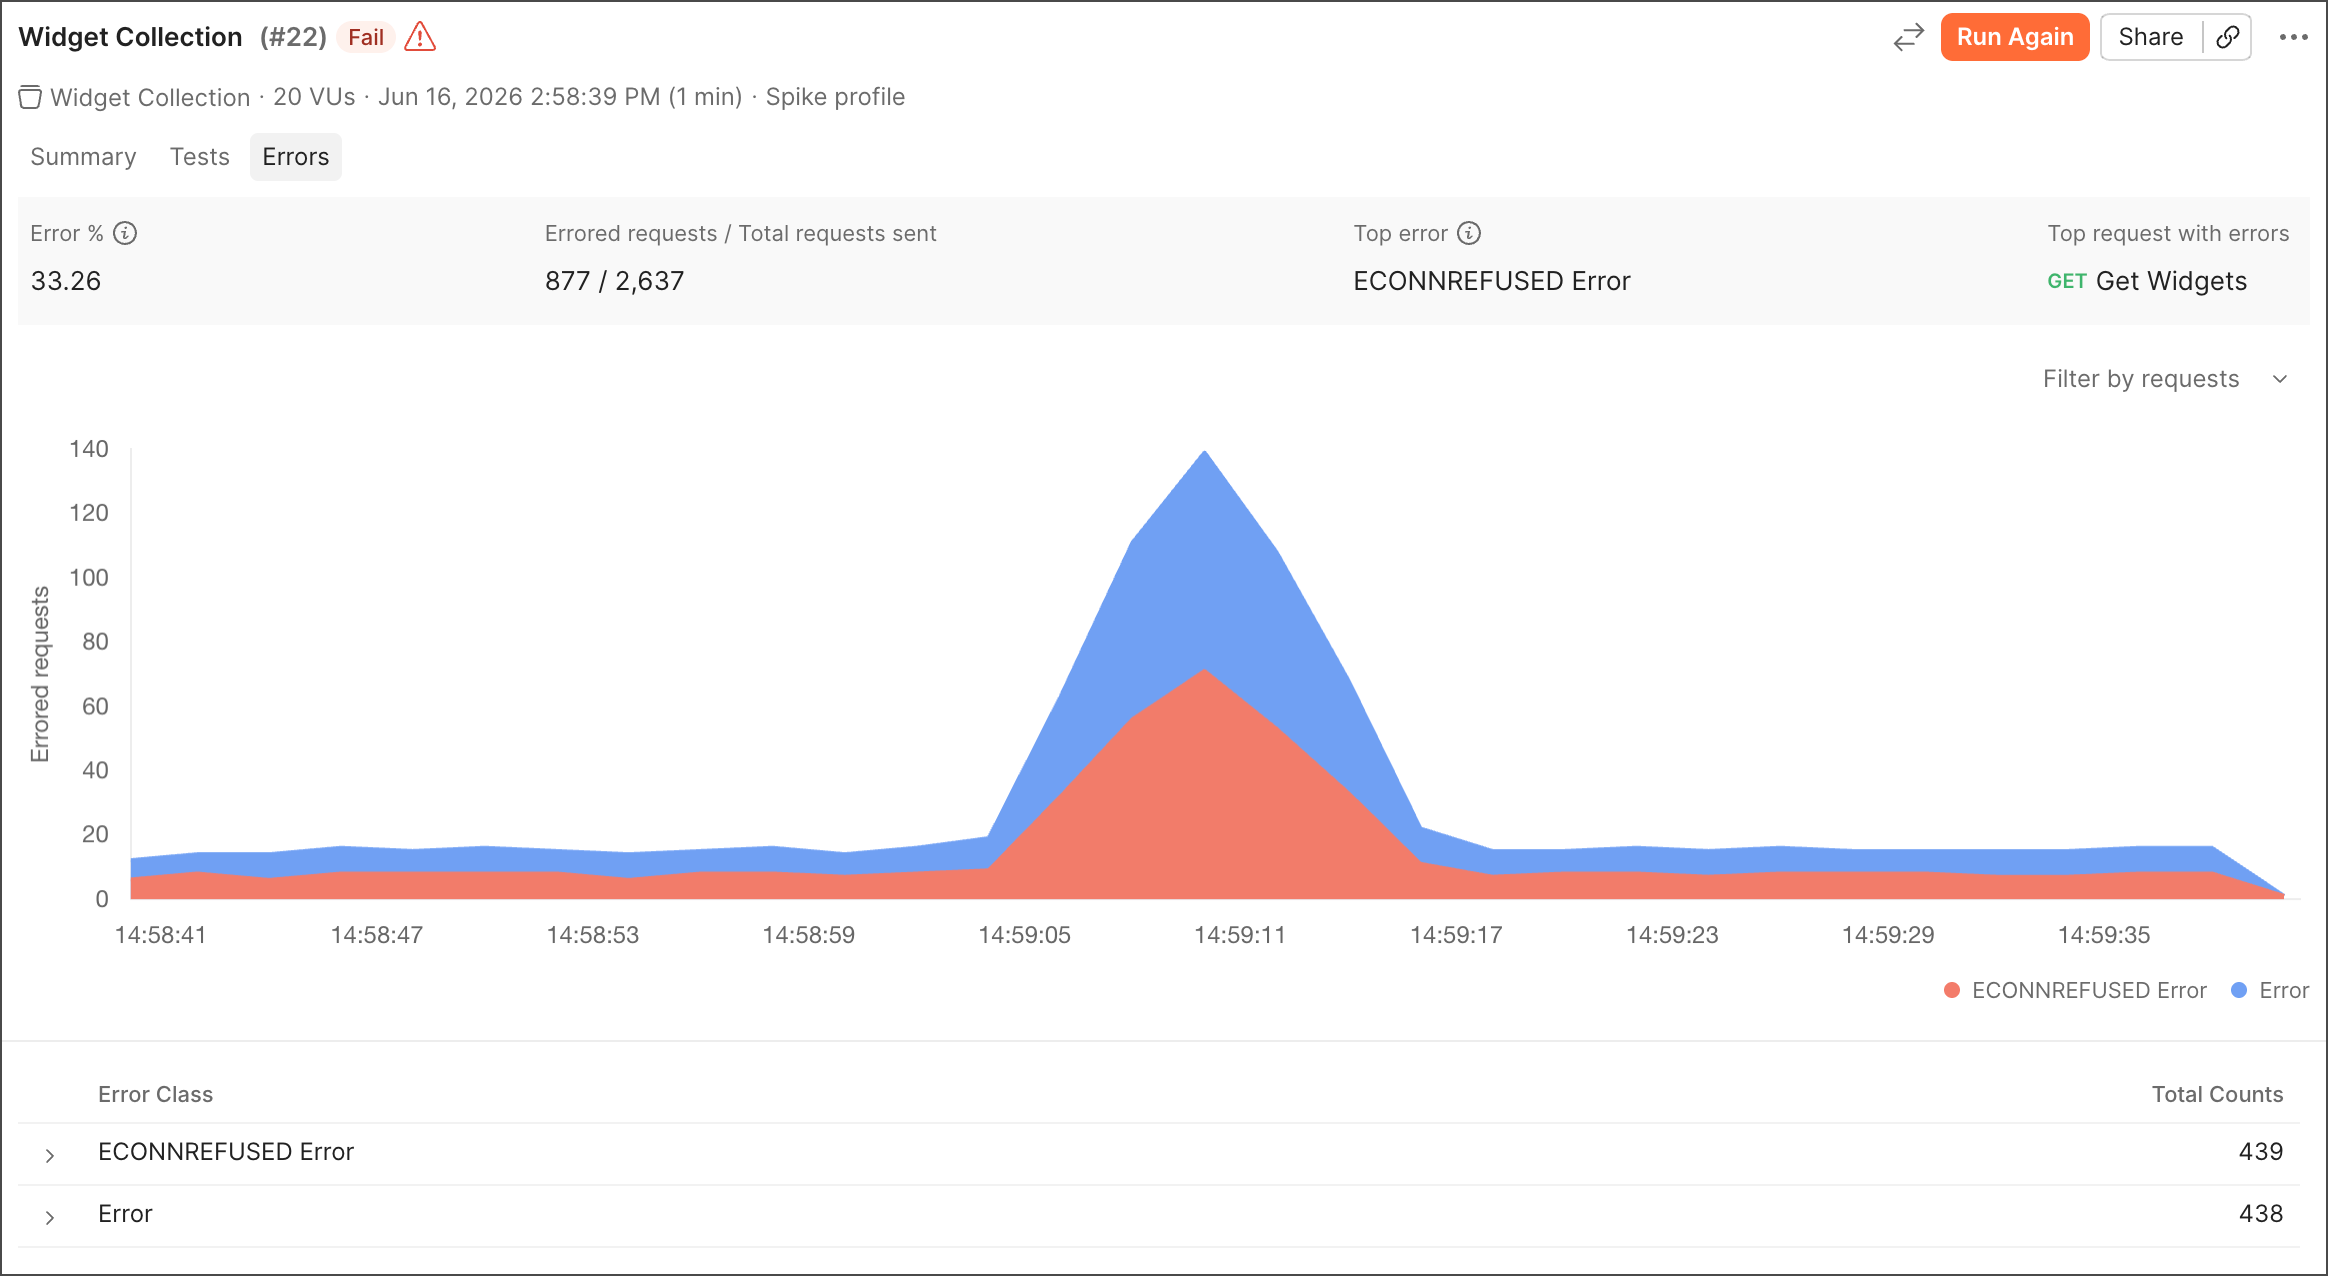
You can view the following information about the error trends:
- Error % — The percentage of requests that result in an error.
- Errored requests / Total requests sent — The number of requests that result in an error per number of requests sent.
- Top error — The type of error that occurred most often during the test.
- Top request with errors — The request that had the highest number of error responses. Select the request name to open the request.
From the Errors tab, you can take the following actions:
- Hover over a point on the graph to view more details.
- Click a metric in the legend below the graph to show or hide that metric in the graph.
- To view the error trends for a specific request, select the request in the dropdown list. This information can help you understand which requests are associated with certain types of errors. To change the graph back to the default view, click Reset.
Debug errors
You can view details about errors that occurred during the performance test to help in the debugging process. The Errors tab displays the error classes encountered during the test and the number of times each error occurred.
Expand an error class below the graph to view all requests that encountered the error. For each request, you can view a list of unique responses (as determined by headers and body). Postman displays the 10 most common responses and shows a count of how often that response occurred.
Click a request to view details about it, including the response, headers, and request body. Use the controls on the Response tab to format, copy, or search within the response. Click the name of a request to open it.
Request and responses details for errors are persisted locally during your current Postman session and aren’t saved permanently. If you close the current tab or quit Postman, request and response details will no longer be available. You’ll still be able to view error classes and error counts for requests.