Insights Latency
The Postman Insights Latency tab fetches latency metrics for the API endpoints that the Postman Insights Agent has observed for your service. It filters for HTTP methods, hosts, path templates, and search queries. You can also sort the results by endpoint name, latency percentile, or request count.
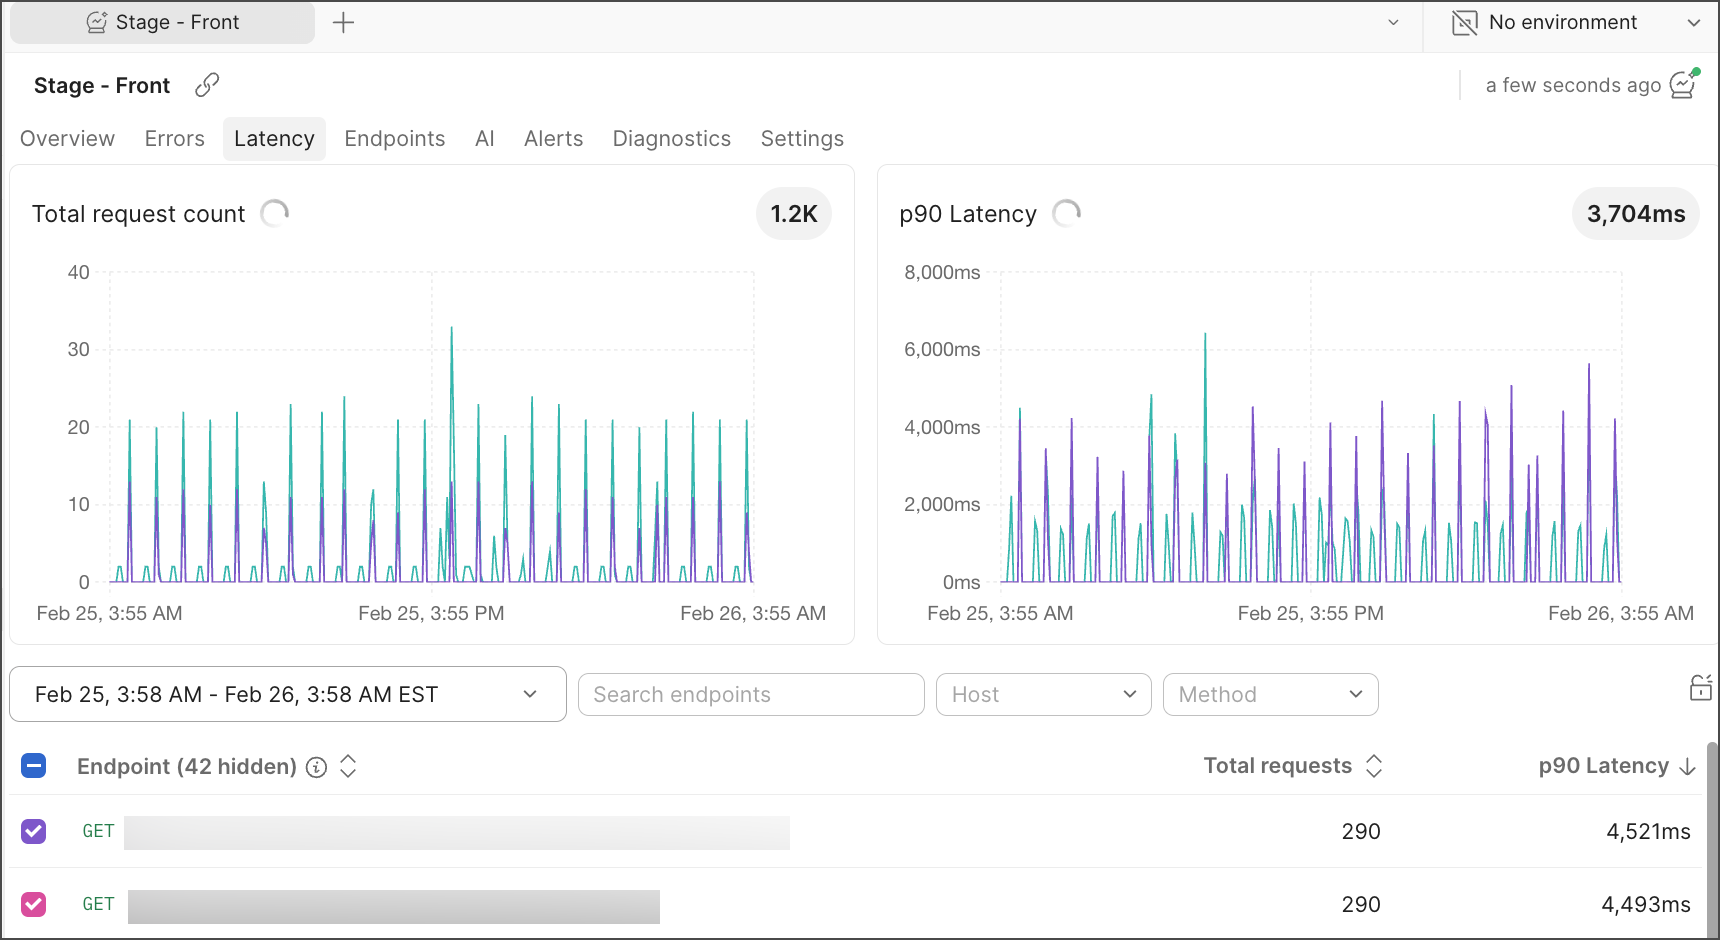
Explore your endpoint latency
To explore latency insights, you can do the following:
-
Select a time range you’re interested in.
You can also drag your cursor over the graph to pinpoint the time range of the event you want to analyze.
-
Sort your endpoints by Total requests or p90 Latency.
-
Search your endpoints by a path field.
-
Filter your endpoints by Host or Method.
-
Select the endpoints of interest.
-
Hover over the data points in the Total request count graph to observe latency percentiles. Hover over the p90 Latency graph to view latency in milliseconds (ms).
To learn more about endpoint data in Postman Insights, see Insights Endpoints. If you haven’t, you can customize your Postman Insights. You can also learn how to debug your endpoints with Insights.