Insights Errors tab
The Errors tab provides a comprehensive view of endpoints with 4xx and 5xx errors across your entire project, to make it easier to help you find and fix errors. Thanks to AI-powered endpoint discovery, the Errors page shows aggregate per-endpoint error data.
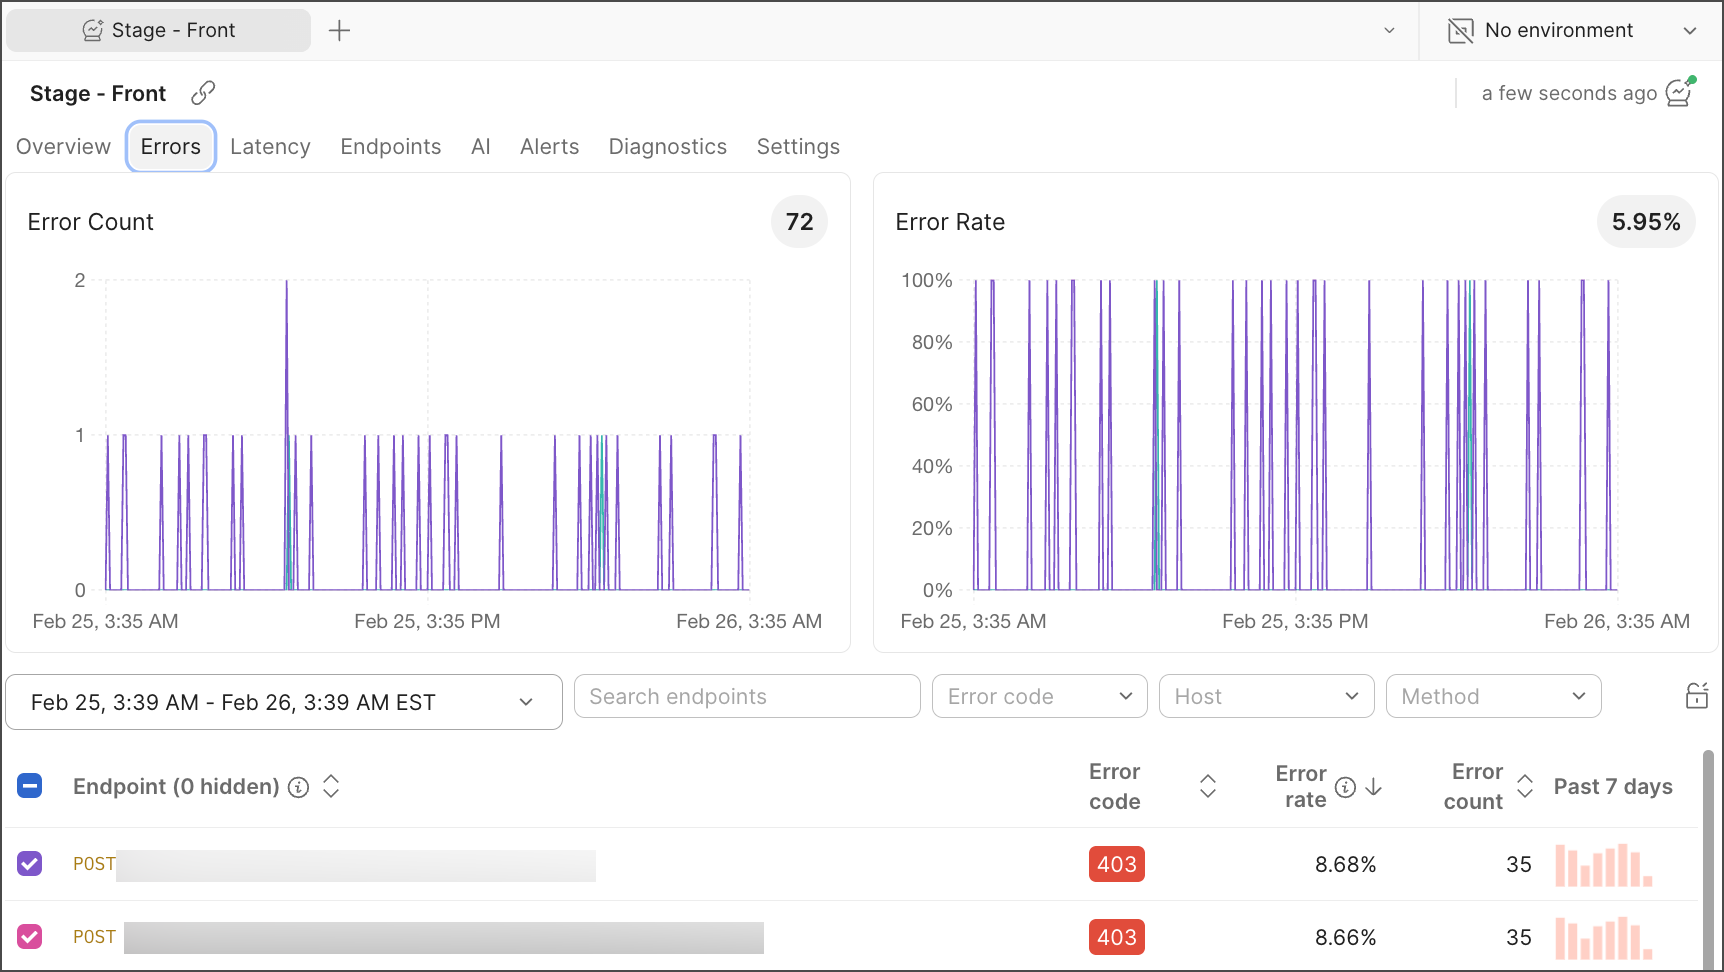
Errors overview
On the Errors overview page, you can search for specific endpoints. You can also filter the selected endpoints by different hosts, methods, categories, and status codes in order to find endpoints you care about.
To change the time range, select the time period for which you want to see the data or use the default options: last 14 days, 7 days, 24 hours, 12 hours, and last hour. Set a custom range, for example, 3 days.
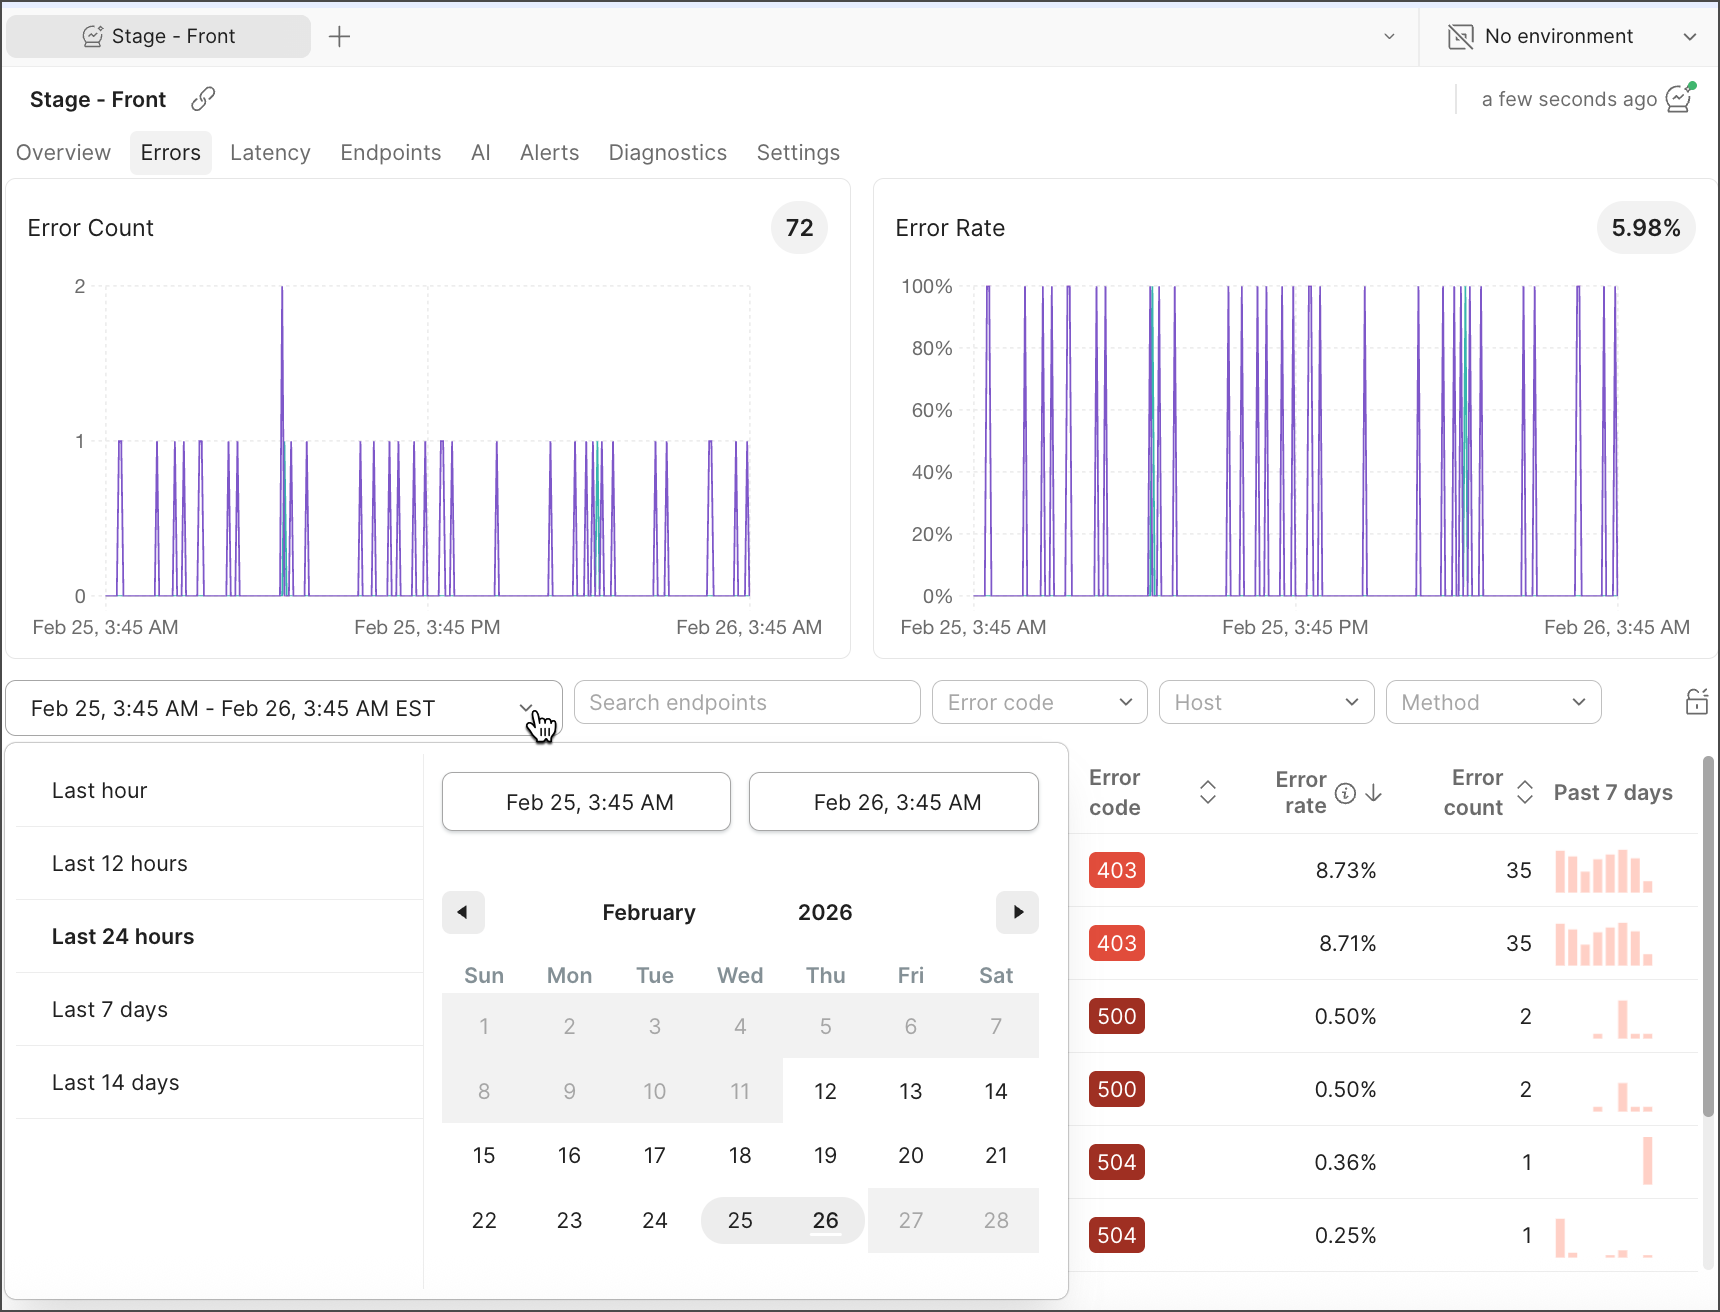
You can also drag your cursor over the graph to pinpoint the time range of the event you want to analyze.
From the Errors overview page, you can click into each endpoint to get more details.
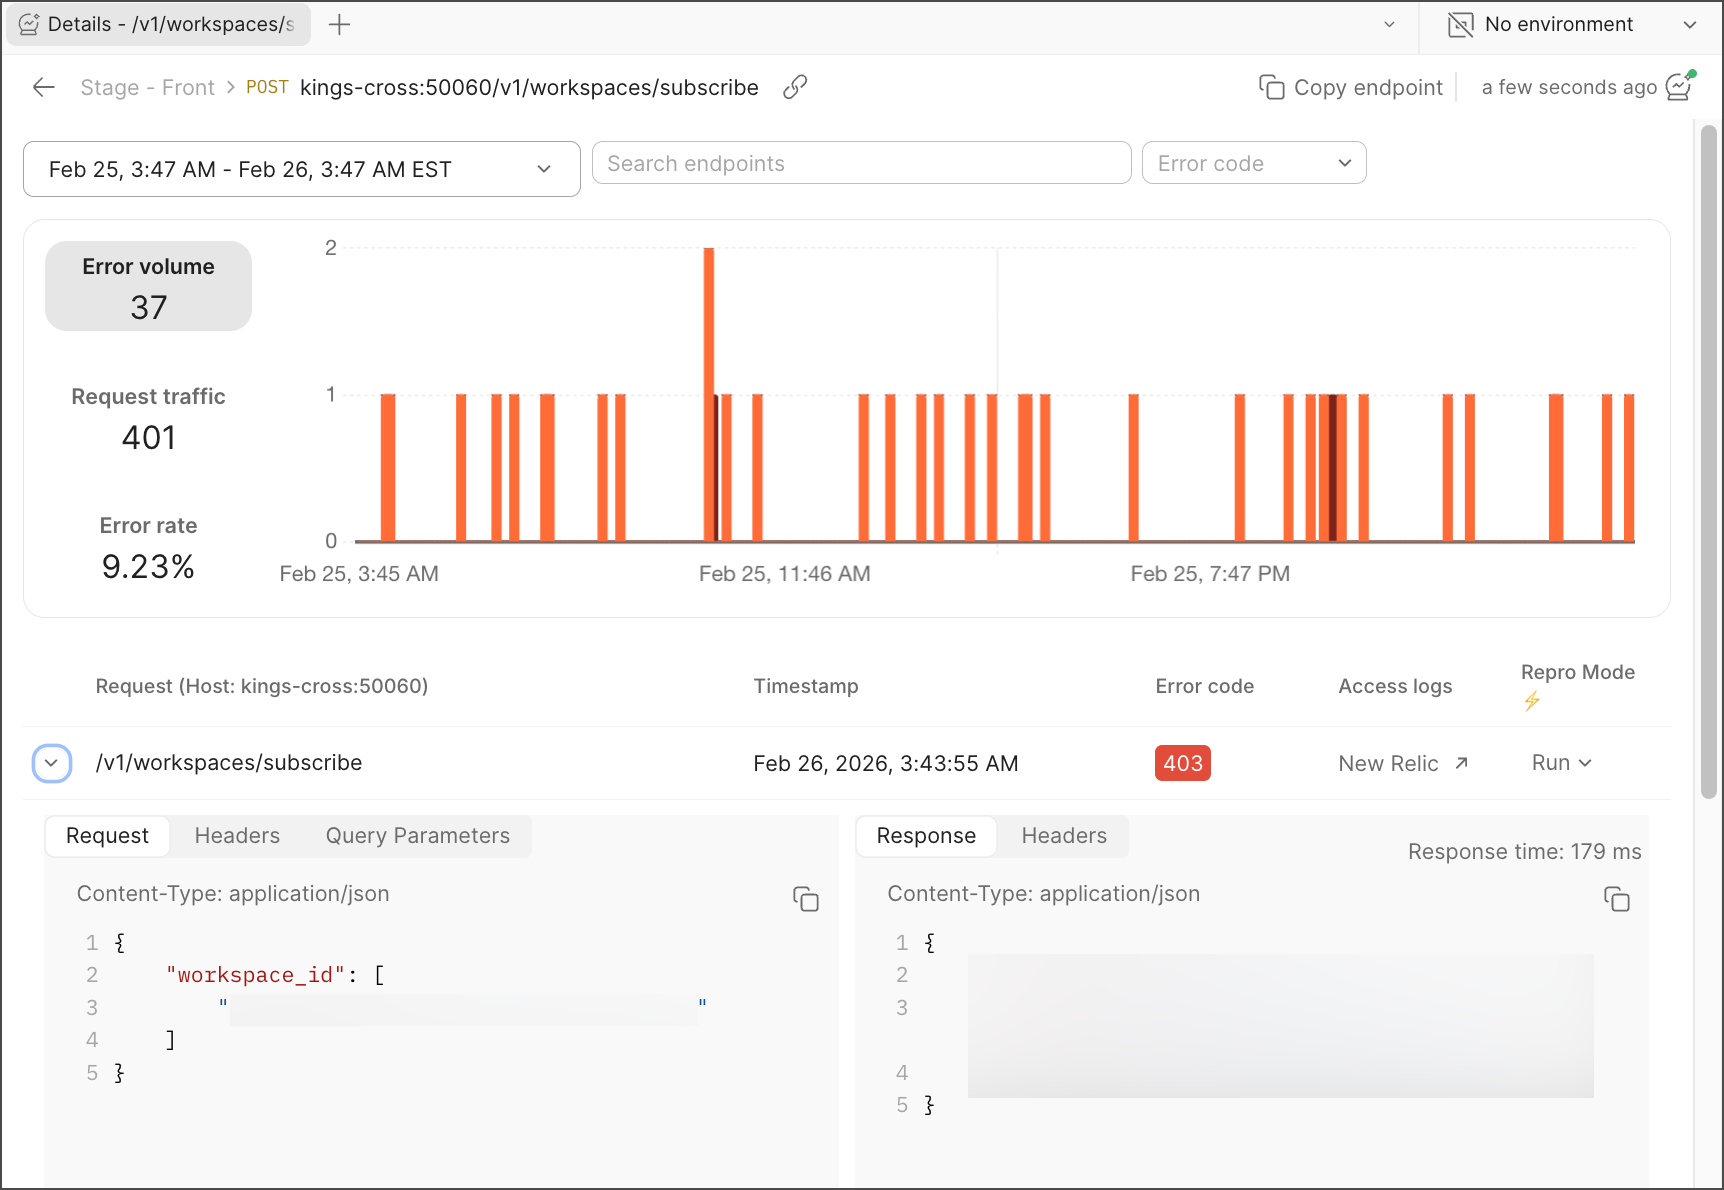
Error details
Each endpoint has an Error detail page that allows you to explore errors for that endpoint.
- You can look at the graph by error volume, request traffic, and error rate.
- Observe unaggregated per-request data.
- Drill down into each request to see the request details.
You can also drag your cursor over the graph to pinpoint the time range of the event you want to analyze.
To learn more about endpoint data in Postman Insights, see Insights Endpoints. If you haven’t, you can customize your Postman Insights. You can also learn how to debug your endpoints with Insights.