Visualize request responses using Postman Visualizer
The Postman Visualizer provides a programmable way to visually represent your request responses. You can also use Postman’s AI assistant Postbot to automate your visualization. If you add a visualization script to the Scripts tab of your request, the result renders in the Visualization tab for the response body. If you don’t create a Visualizer script, use Postbot to generate a visualization.

The Visualizer enables you to present your response data in ways that help to make sense of it. You can use this to model and highlight the information that’s relevant to your project, instead of having to read through raw response data. When you share a Postman Collection, other people on your team can also understand your visualizations within the context of each request.
Visualize response data
To visualize your response data, add code to the Pre-request or Post-response script for the request. The pm.visualizer.set() method applies your Visualizer code to the data and presents it in the Visualization tab when the request runs.
Add Visualizer code
The pm.visualizer.set() method accepts a Handlebars template string as its first parameter. The second parameter is the data you want to use the template to display. Read on to learn how you can build a Handlebars template and pass data to it.
To see an example of the Visualizer in action, click Run in Postman and fork the collection in Postman:
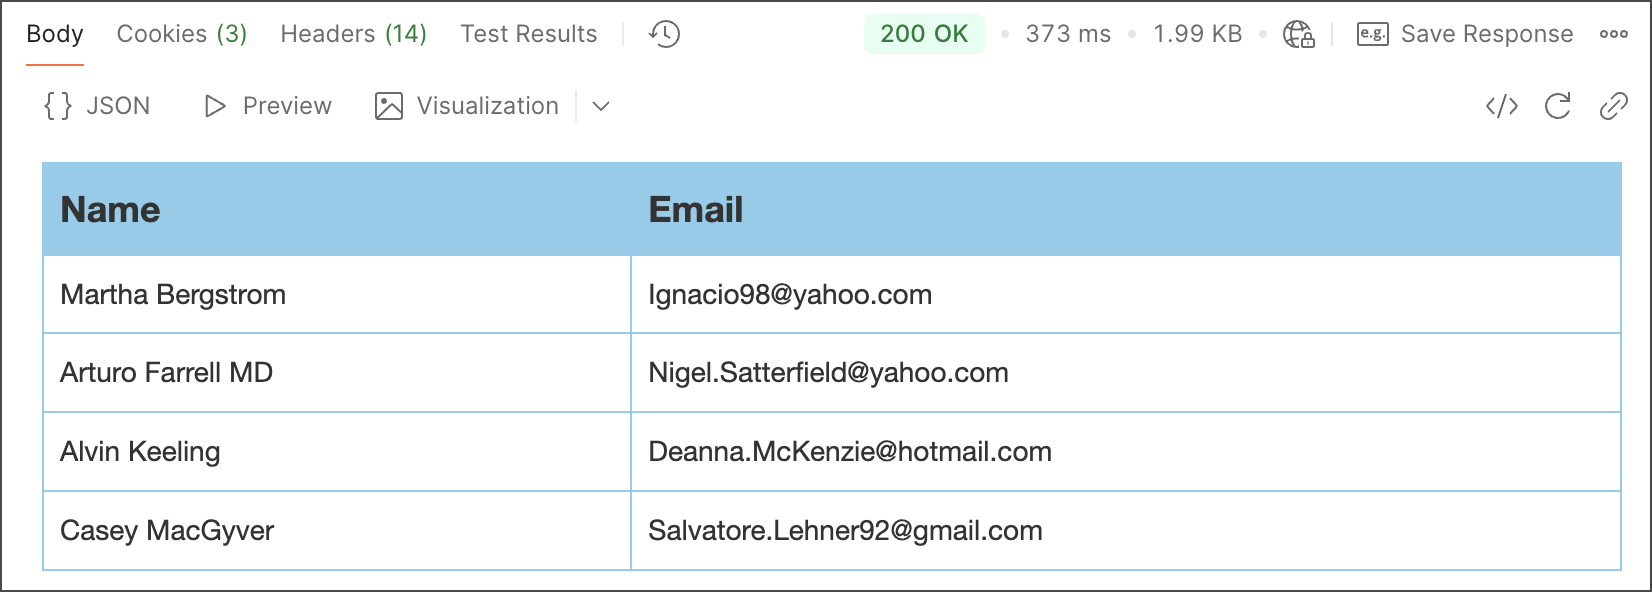
In the first request, the example endpoint responds with a list of names and email addresses with the following JSON response body structure:
The Visualizer code creates a Handlebars template to render a table displaying the names and email addresses by looping over an array. Handlebars can do this with the {{#each}} tag. The following runs as a Post-response script in the request:
The variable names inside the double curly braces in the template are substituted with the data passed to the pm.visualizer.set() method. To apply the template, the following code completes the Post-response script:
The template variable is the template string created earlier. The second argument passed is an object defined as the response property. This is the variable that the template expects in the {{#each response}} loop. The value assigned to the response property is the response JSON data from the request parsed as an object.
View visualizations
Click Send to run the request in Postman, then click the Visualization tab. Postman renders the table as HTML, as it would be in a web browser.

Add styling and interaction to visualizations
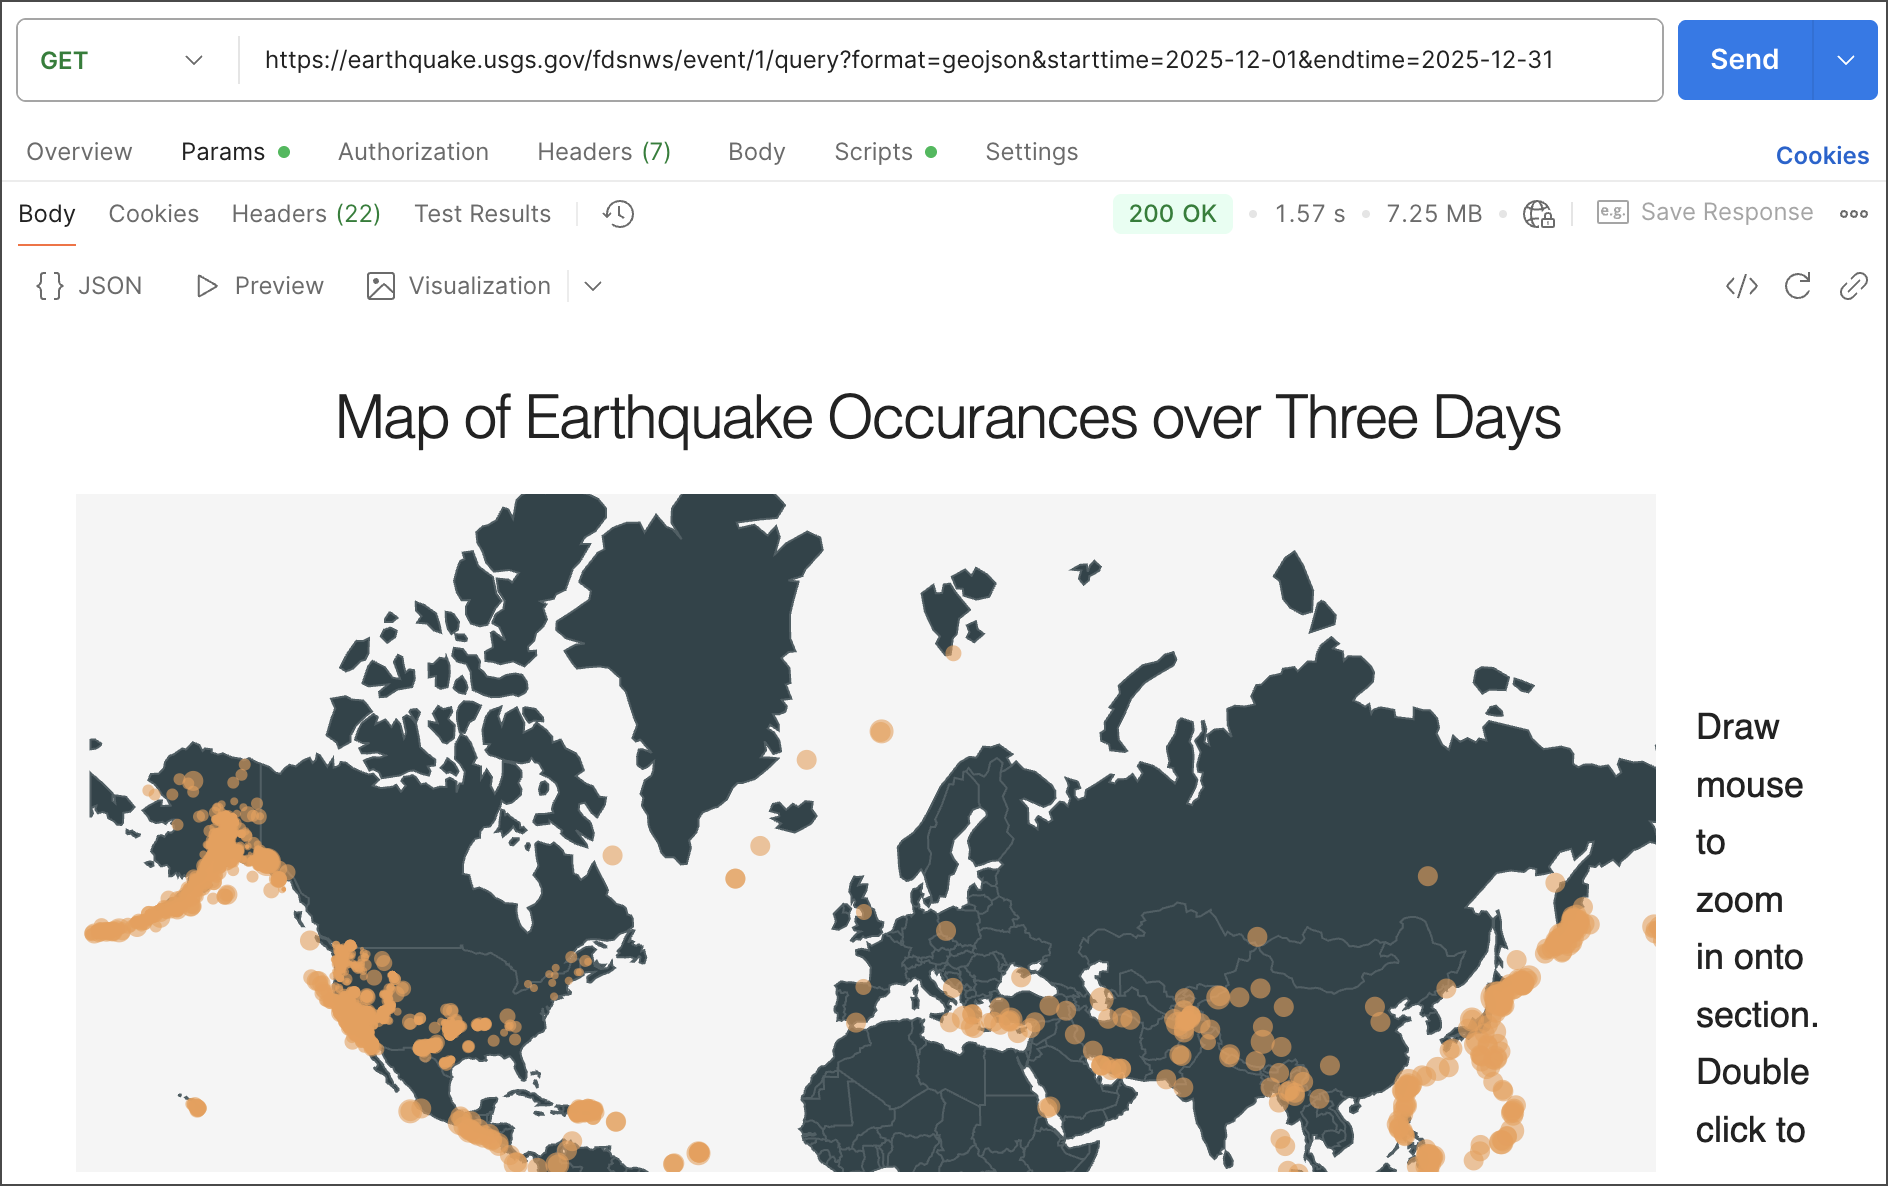
You can load an external stylesheet using <link> tags in your HTML template code, using the same technique as adding a stylesheet to a web page. You can also add stylesheets as <style> tags. Similarly, you can add interactions using JavaScript code in <script> tags inside your template HTML code.
Note
Visualizer doesn’t support interactions that download resources.
Use your own libraries
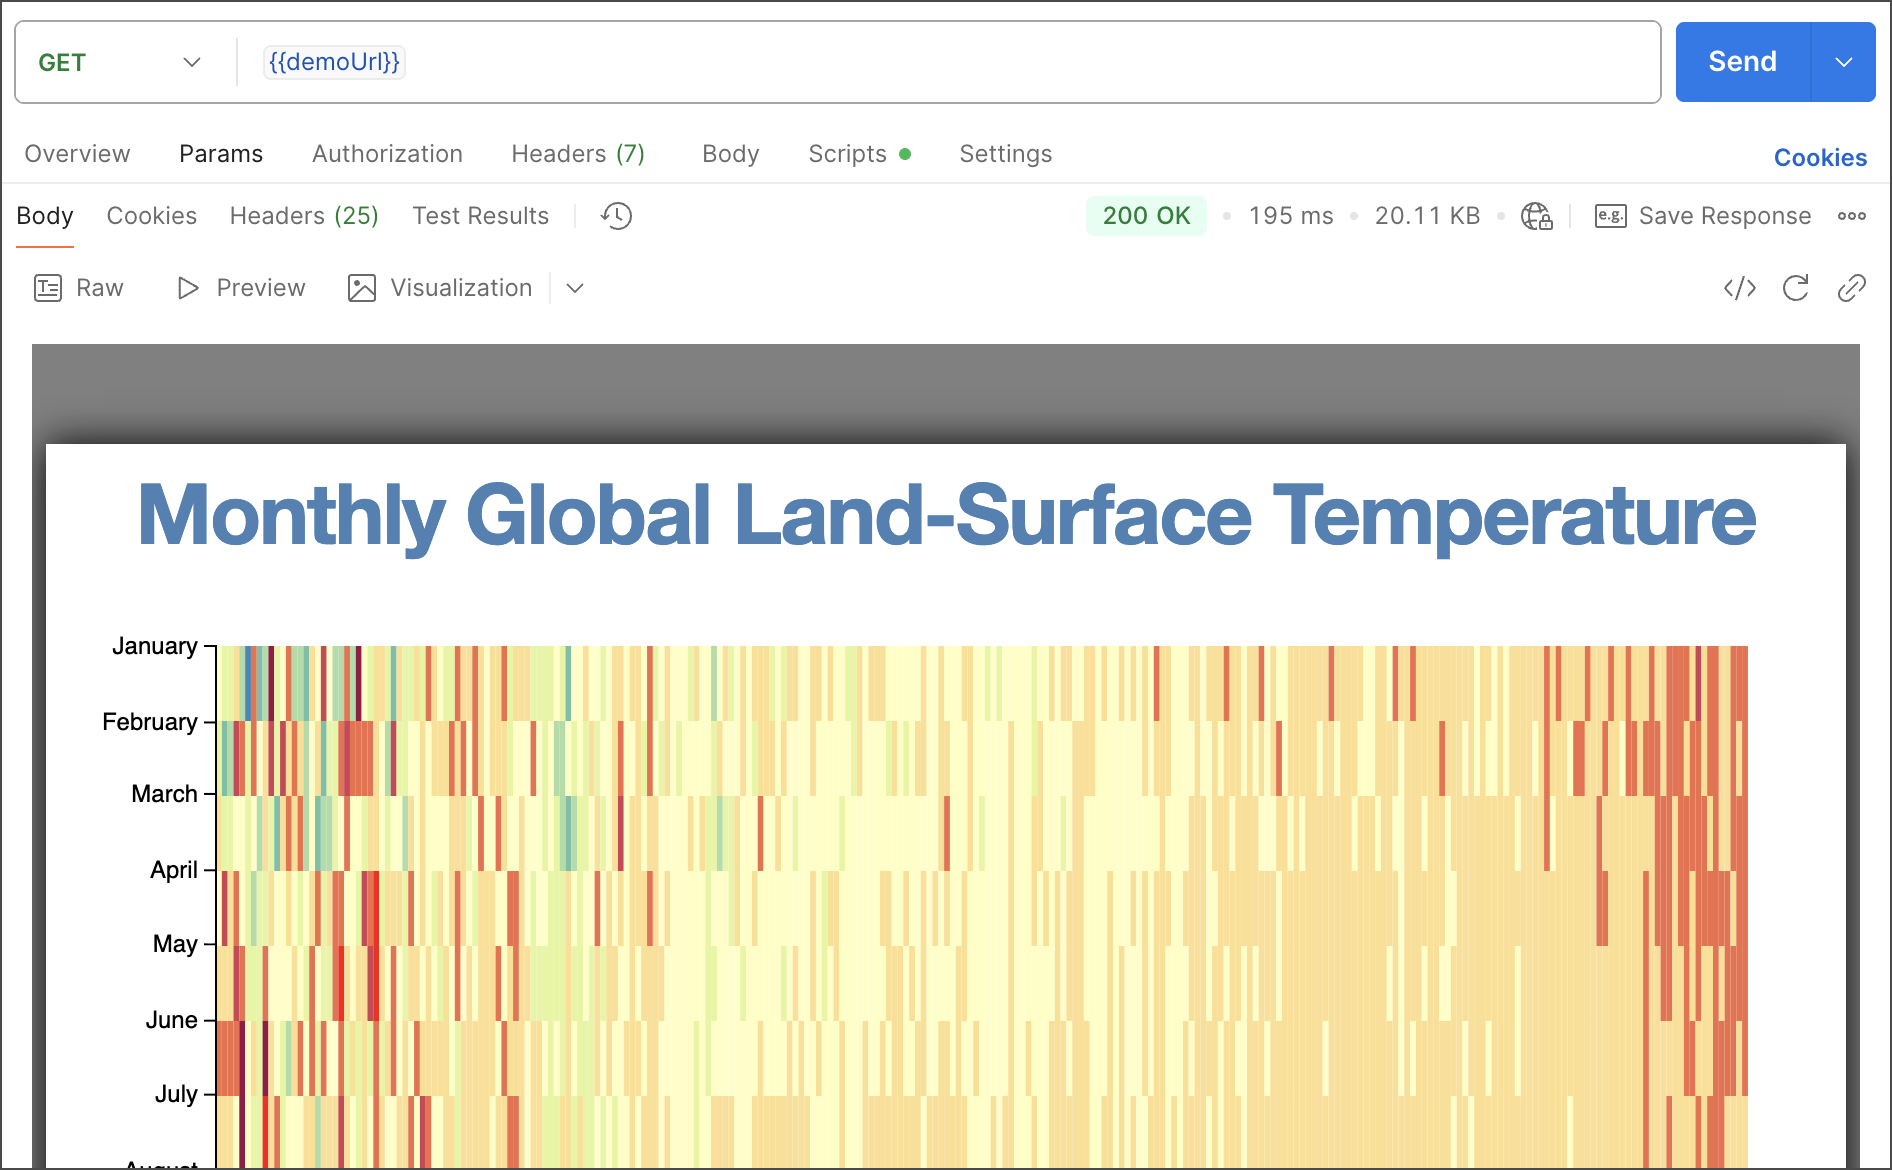
You can use any of the libraries in the Postman Sandbox to programmatically generate the layout template. To import another external JavaScript library, add the URL to a <script> tag in the template code, like you would to load JavaScript into an HTML file. This lets you render your request data using the visualization tool of your choice (for example, D3.js).
Access data inside the template
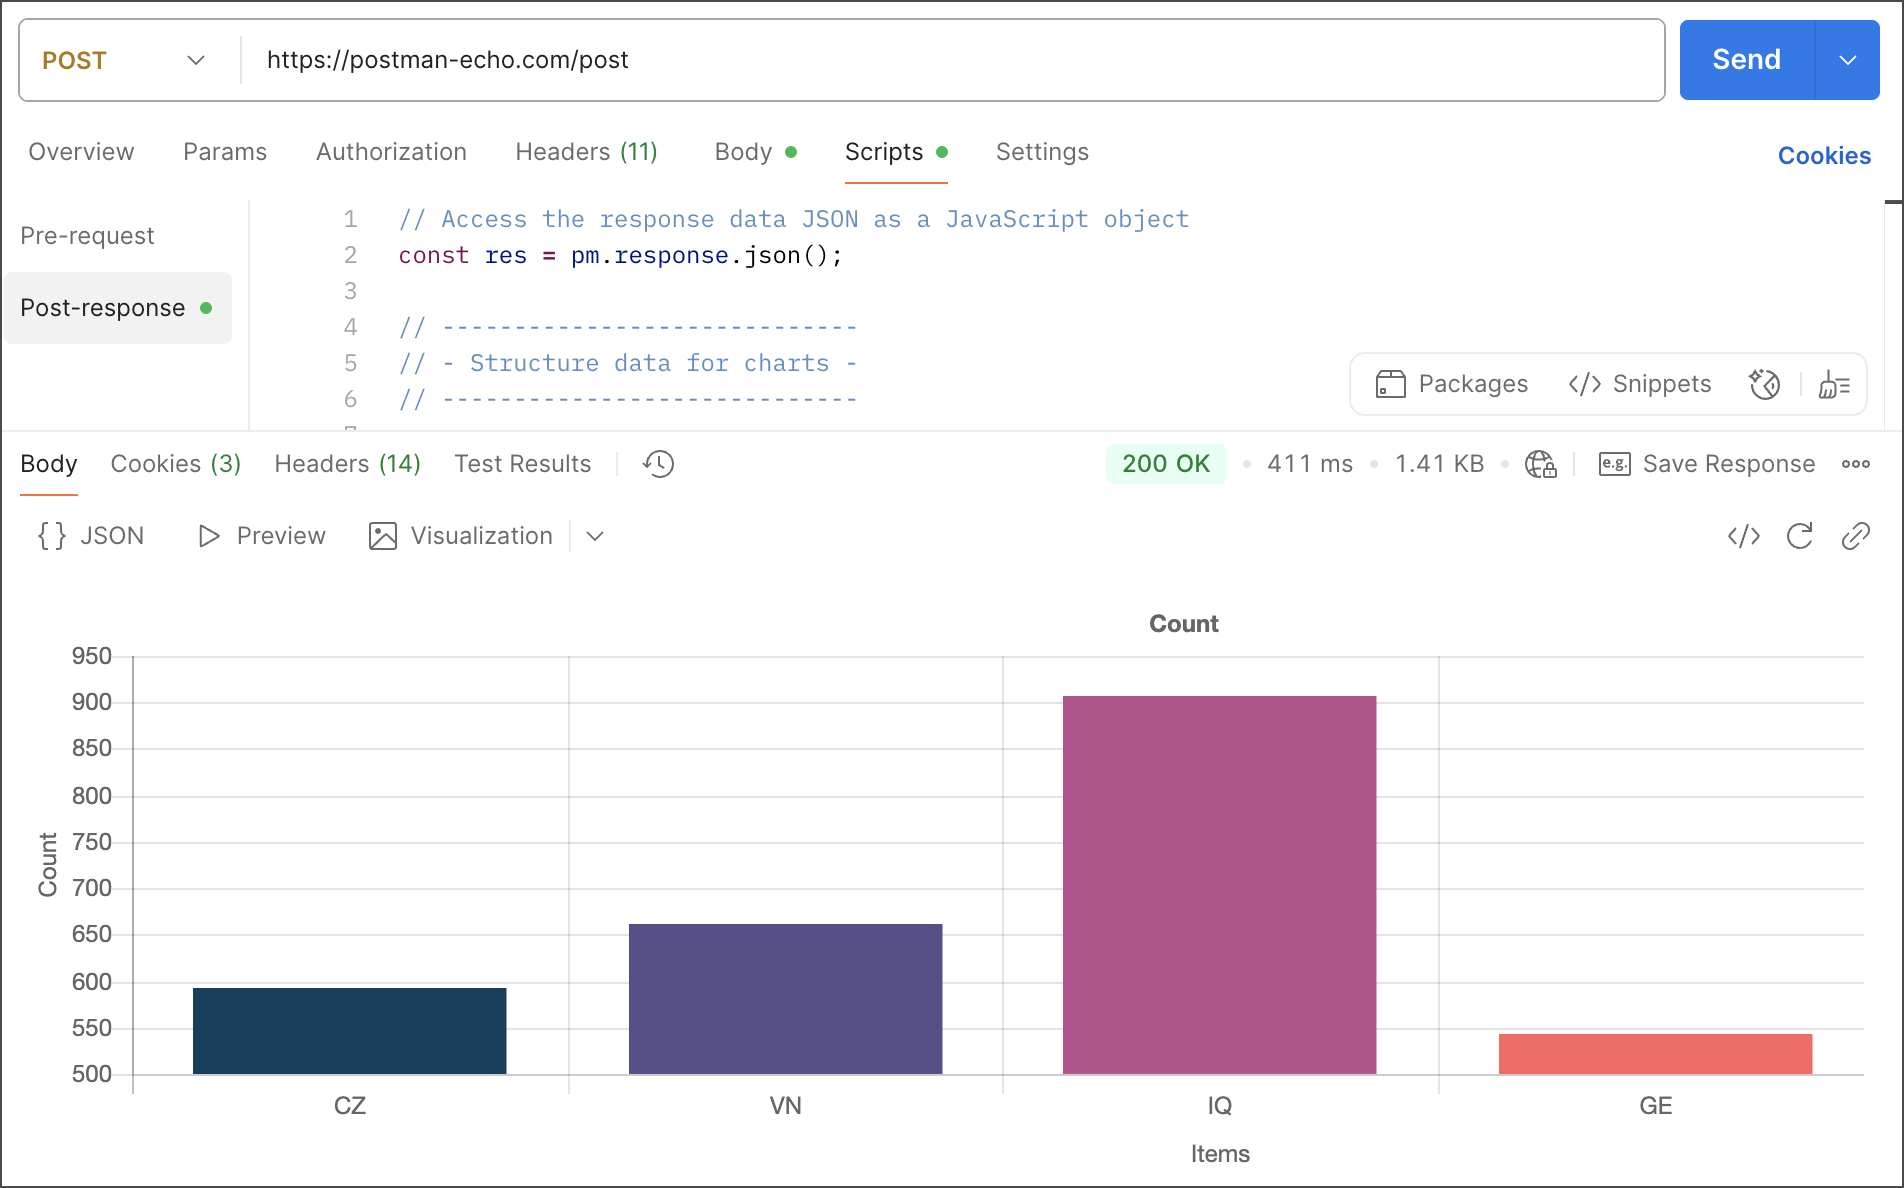
Any <script> elements inside your template can access the data passed in the second argument to pm.visualizer.set() by calling the pm.getData(callback) method. This is only applicable to JavaScript code in the template. For example, your template might include code to render a chart.
The pm.getData(callback) method takes a callback function as its parameter. This callback accepts the error and data parameters. The second parameter is the data passed to pm.visualizer.set().
Use Postbot to create visualizations
Not sure how to write a visualization for your request? Ask Postbot! Tell Postbot what you want to do using plain language, and Postman uses artificial intelligence to generate a visualization for you. Use Postbot to create a new visualization, change the type of visualization, fix your existing visualization, and more.
To create a visualization with Postbot, do the following:
- Send your request so it has a response.
- In the Body tab of the response, click
next to
Visualizer.
- In the menu, select your visualization option. Or, select Set up with a prompt to visualize your response in another format.
When you select Set up with a prompt, you can complete a preset prompt Visualize response as or enter your own, for example, Create a pie chart.
Once you create a visualization or close the Postbot window, you can access Postbot again from the footer or the Scripts tab.
Tip
You can help improve Postbot by sharing your feedback with Postman. Selecting Share Details opens up a GitHub issue request.
For more information on Postbot, visit About Postbot.
Try it out
For more examples of Visualizer code in action, add any of the following collections to your workspace by forking the collection. You can also export and then import the collection. After you fork or import the collection, open a request from Collections in the sidebar, then select Send. Postman displays the rendered data in the Visualization tab.
Visualizer API
You can access the Visualizer from the Postman API. The pm.visualizer.set() method accepts the following parameters:
layout--- (Required) The first parameter is a Handlebars HTML template string.data--- The second parameter is data that you can bind to the template. The properties of this object can be accessed in the template.options--- The third argument is anoptionsobject forHandlebars.compile(). You can use this to control how Handlebars compiles the template.
Postman uses the information you pass to pm.visualizer.set() to render an HTML page in the sandbox for the Visualizer. Click Visualization for the rendered HTML page. The
layout string is inserted into the <body> of the rendered page, including any of the template’s JavaScript, CSS, and HTML.
Debugging the Visualizer
You can debug a visualization in Postman by right-clicking in the Visualization area, then clicking Inspect visualization. This opens the Visualizer Developer Tools attached to the sandbox. You can use it in the same way as debugging a web page.
Note
The Visualizer Developer Tools are only available in the Postman desktop app.

Next steps
Now that you’ve learned about visualizing responses in Postman, you can start creating visualizations of your own.
- To get started, you can experiment with the More Visualizer examples workspace. Run the example requests, then adjust the code to get the results you need for your own data.
- For more information about how Postman provides access to your response data inside scripts, visit Postman test script examples.


