Debug with Insights
Repro Mode aims to make it seamless to rerun requests using real user data from production. The Insights Agent prefills the data for you from the observed traffic, eliminating the need to check logs and traces to find the elements needed to send the request and fix your failing endpoint.
Before you can reproduce your errors, you need to decide which data needs to be redacted and turn on Repro Mode in the Settings tab.
Locate your error
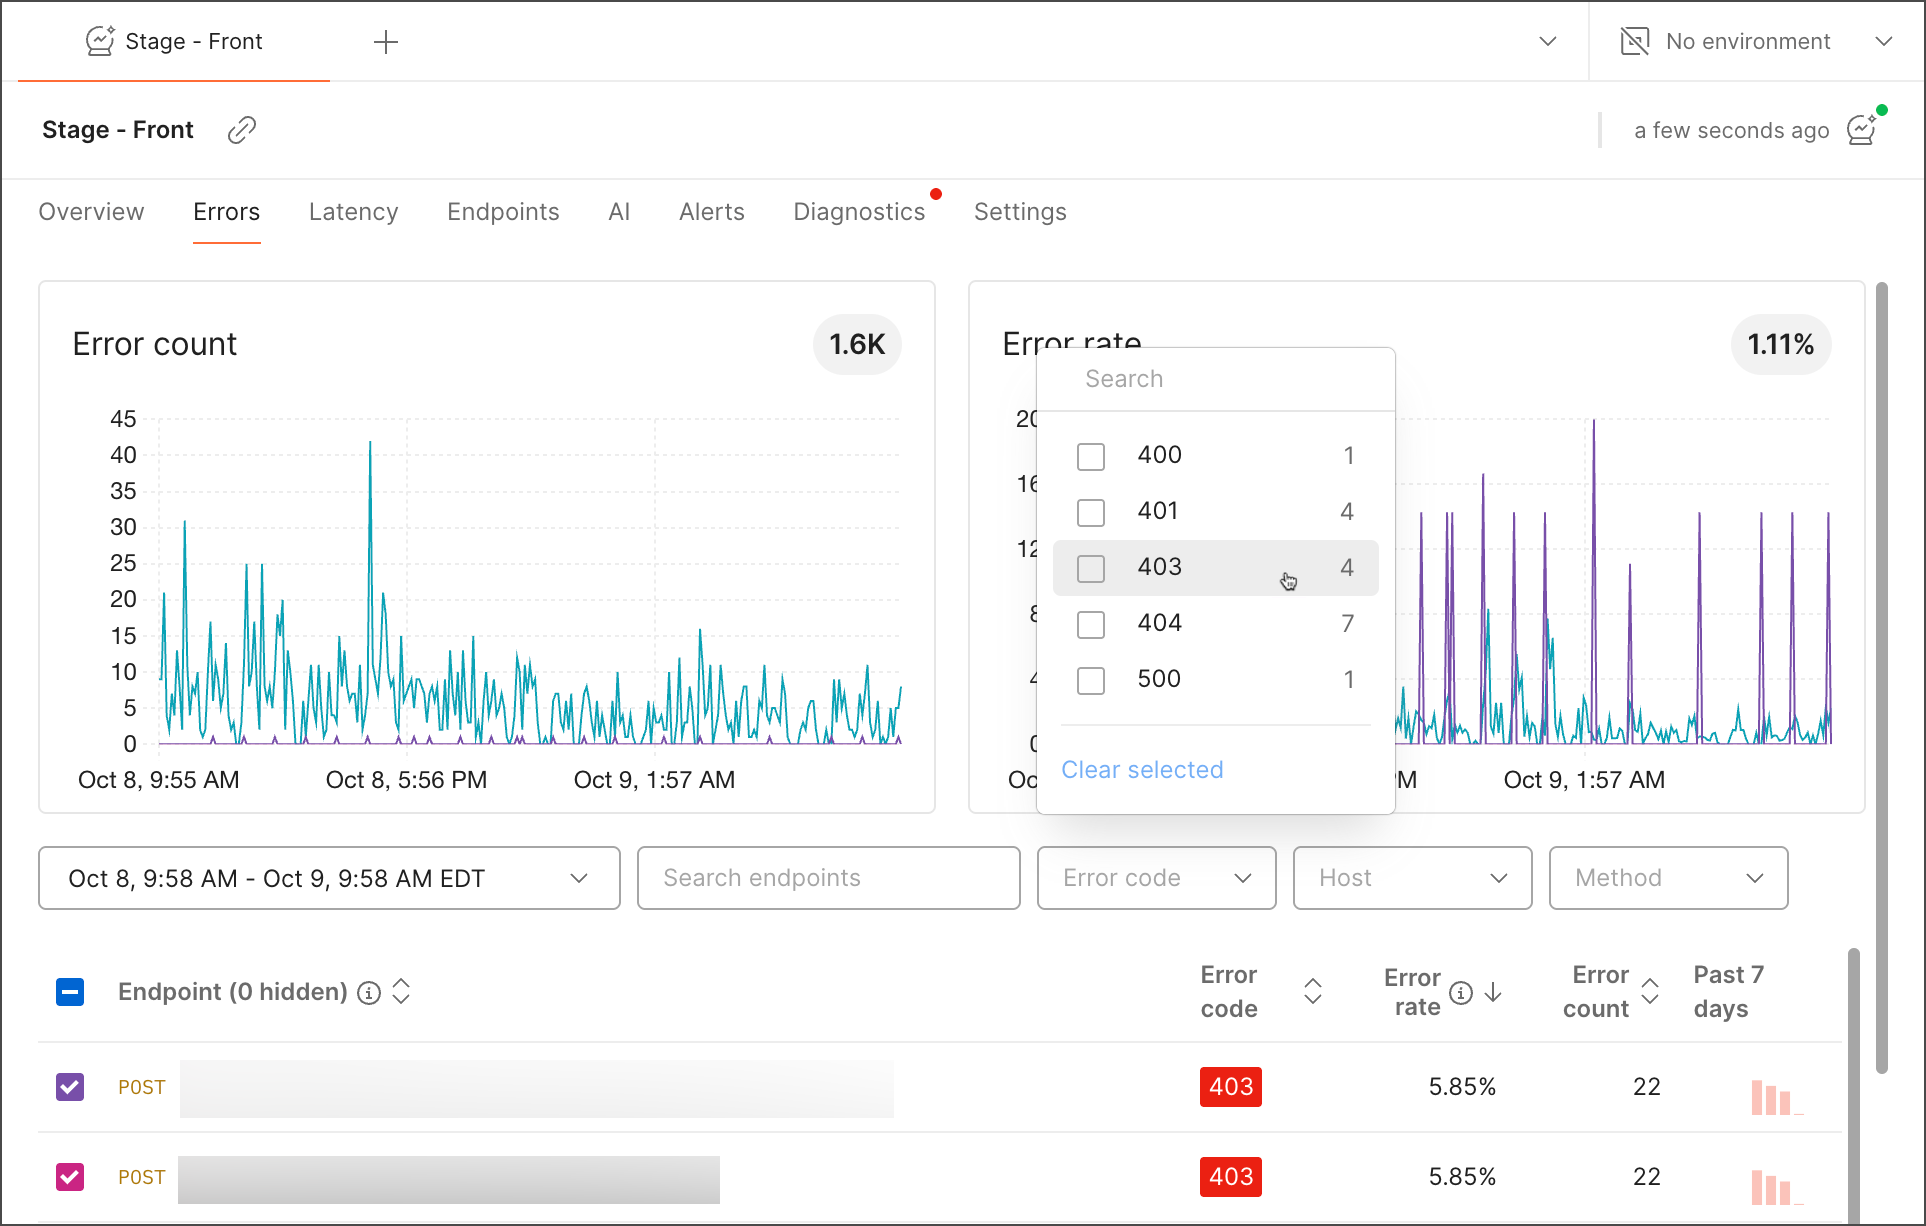
If you know you have an error but don’t know exactly which endpoint, or if you are wondering whether you have errors at all, you can find them in the Error overview page.
Use Repro Mode
Before you begin, check that the Repro Mode is enabled in the Settings tab. This procedure assumes that you enabled the --repro-mode flag during your Insights Agent configuration.
You can access Repro Mode from an Error details page, which you get to by selecting an endpoint from the Overview, Errors, and Endpoints tabs.
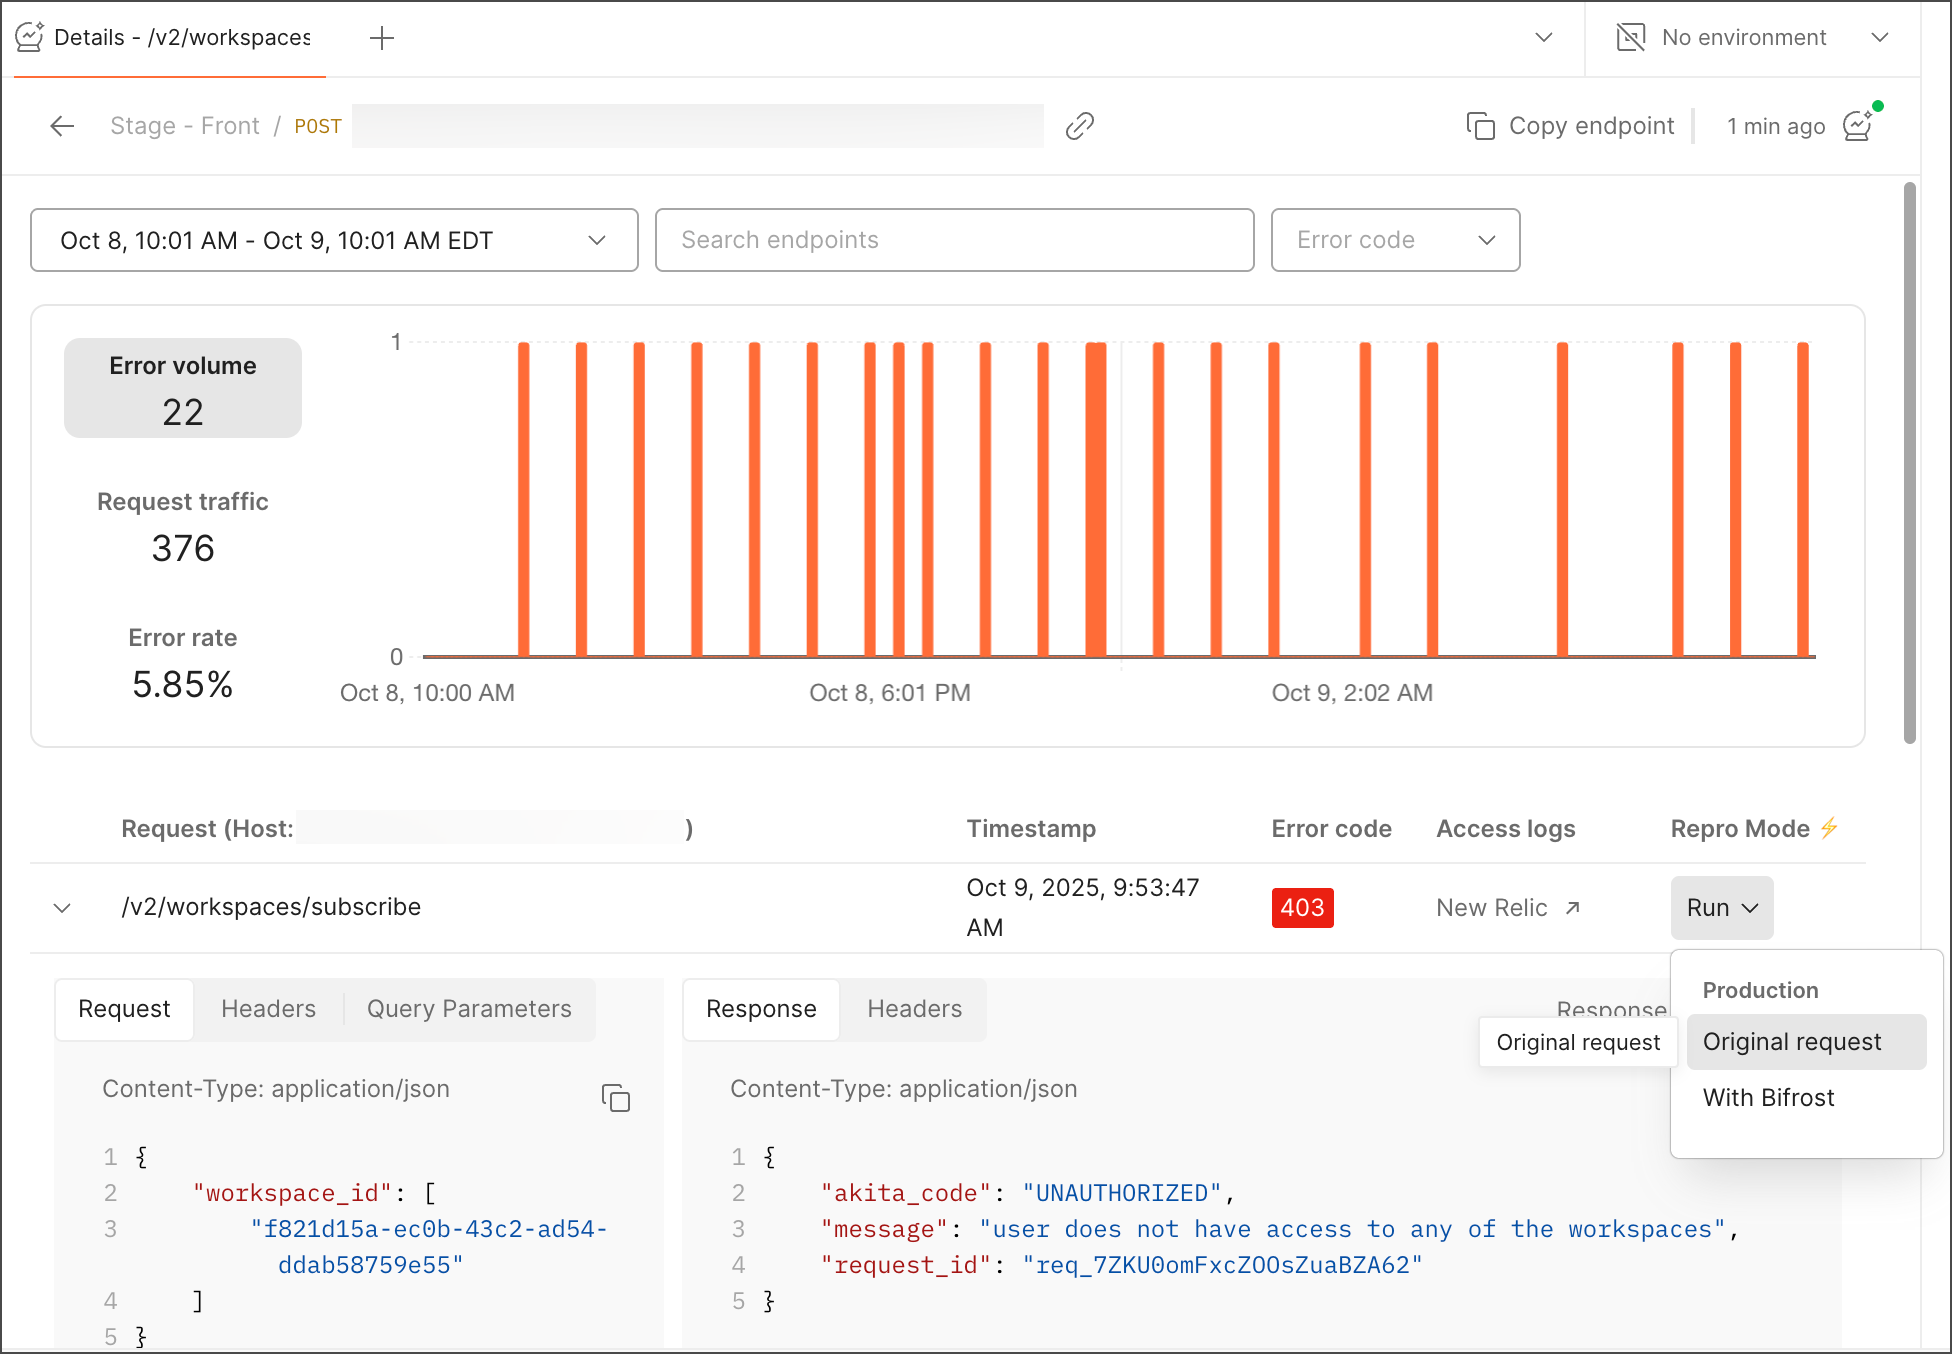
To use Repro Mode, select the Run dropdown.
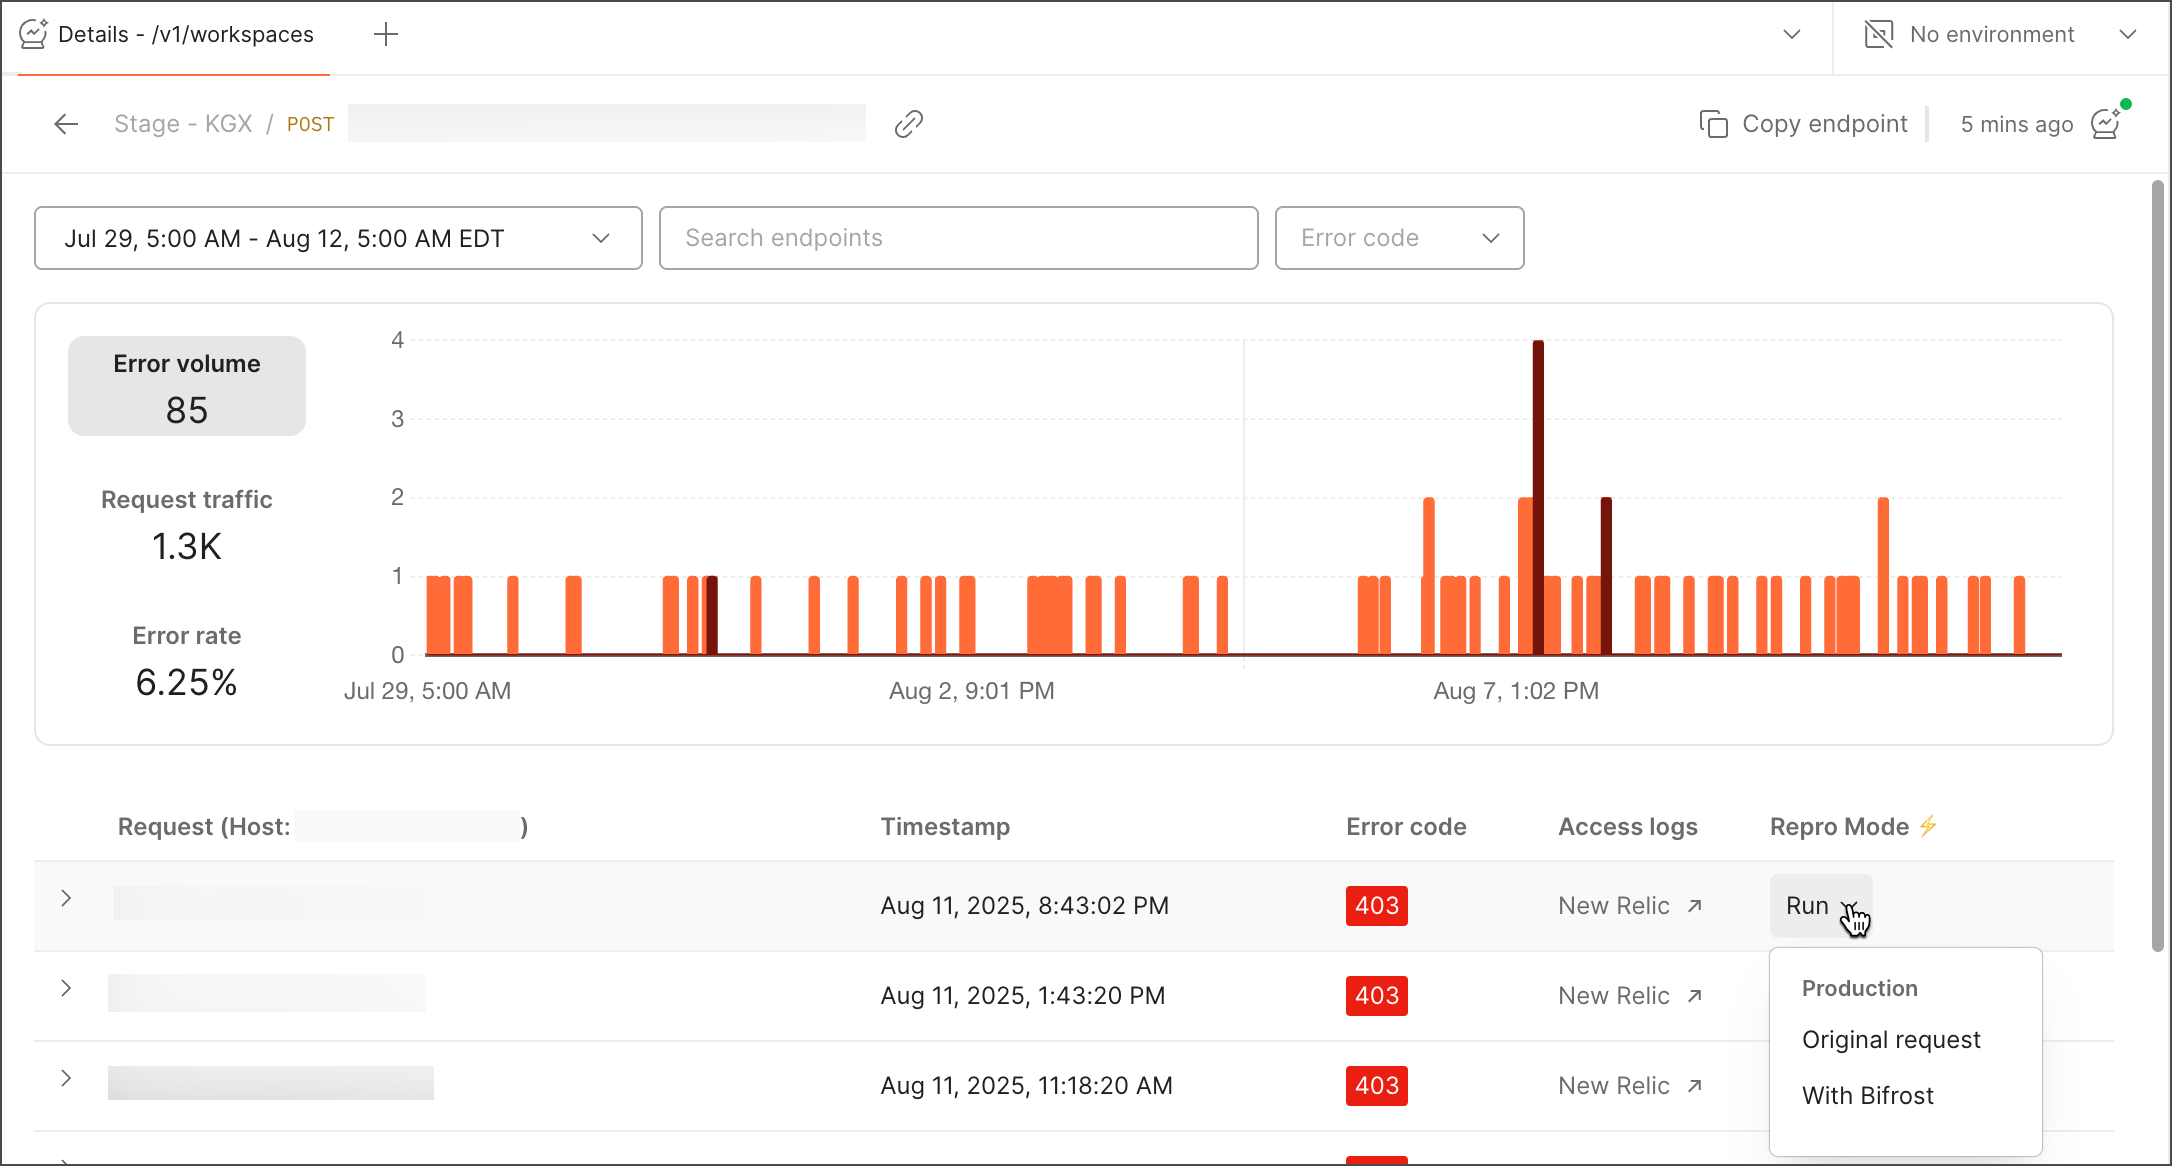
Clicking Original request takes you to Postman’s request builder, where you can reproduce your error.
Debug your endpoint with Repro Mode
To debug a failing endpoint, do the following:
-
From the Errors tab, search and filter endpoints by time range, error code, host, or method. You can also use text search.
-
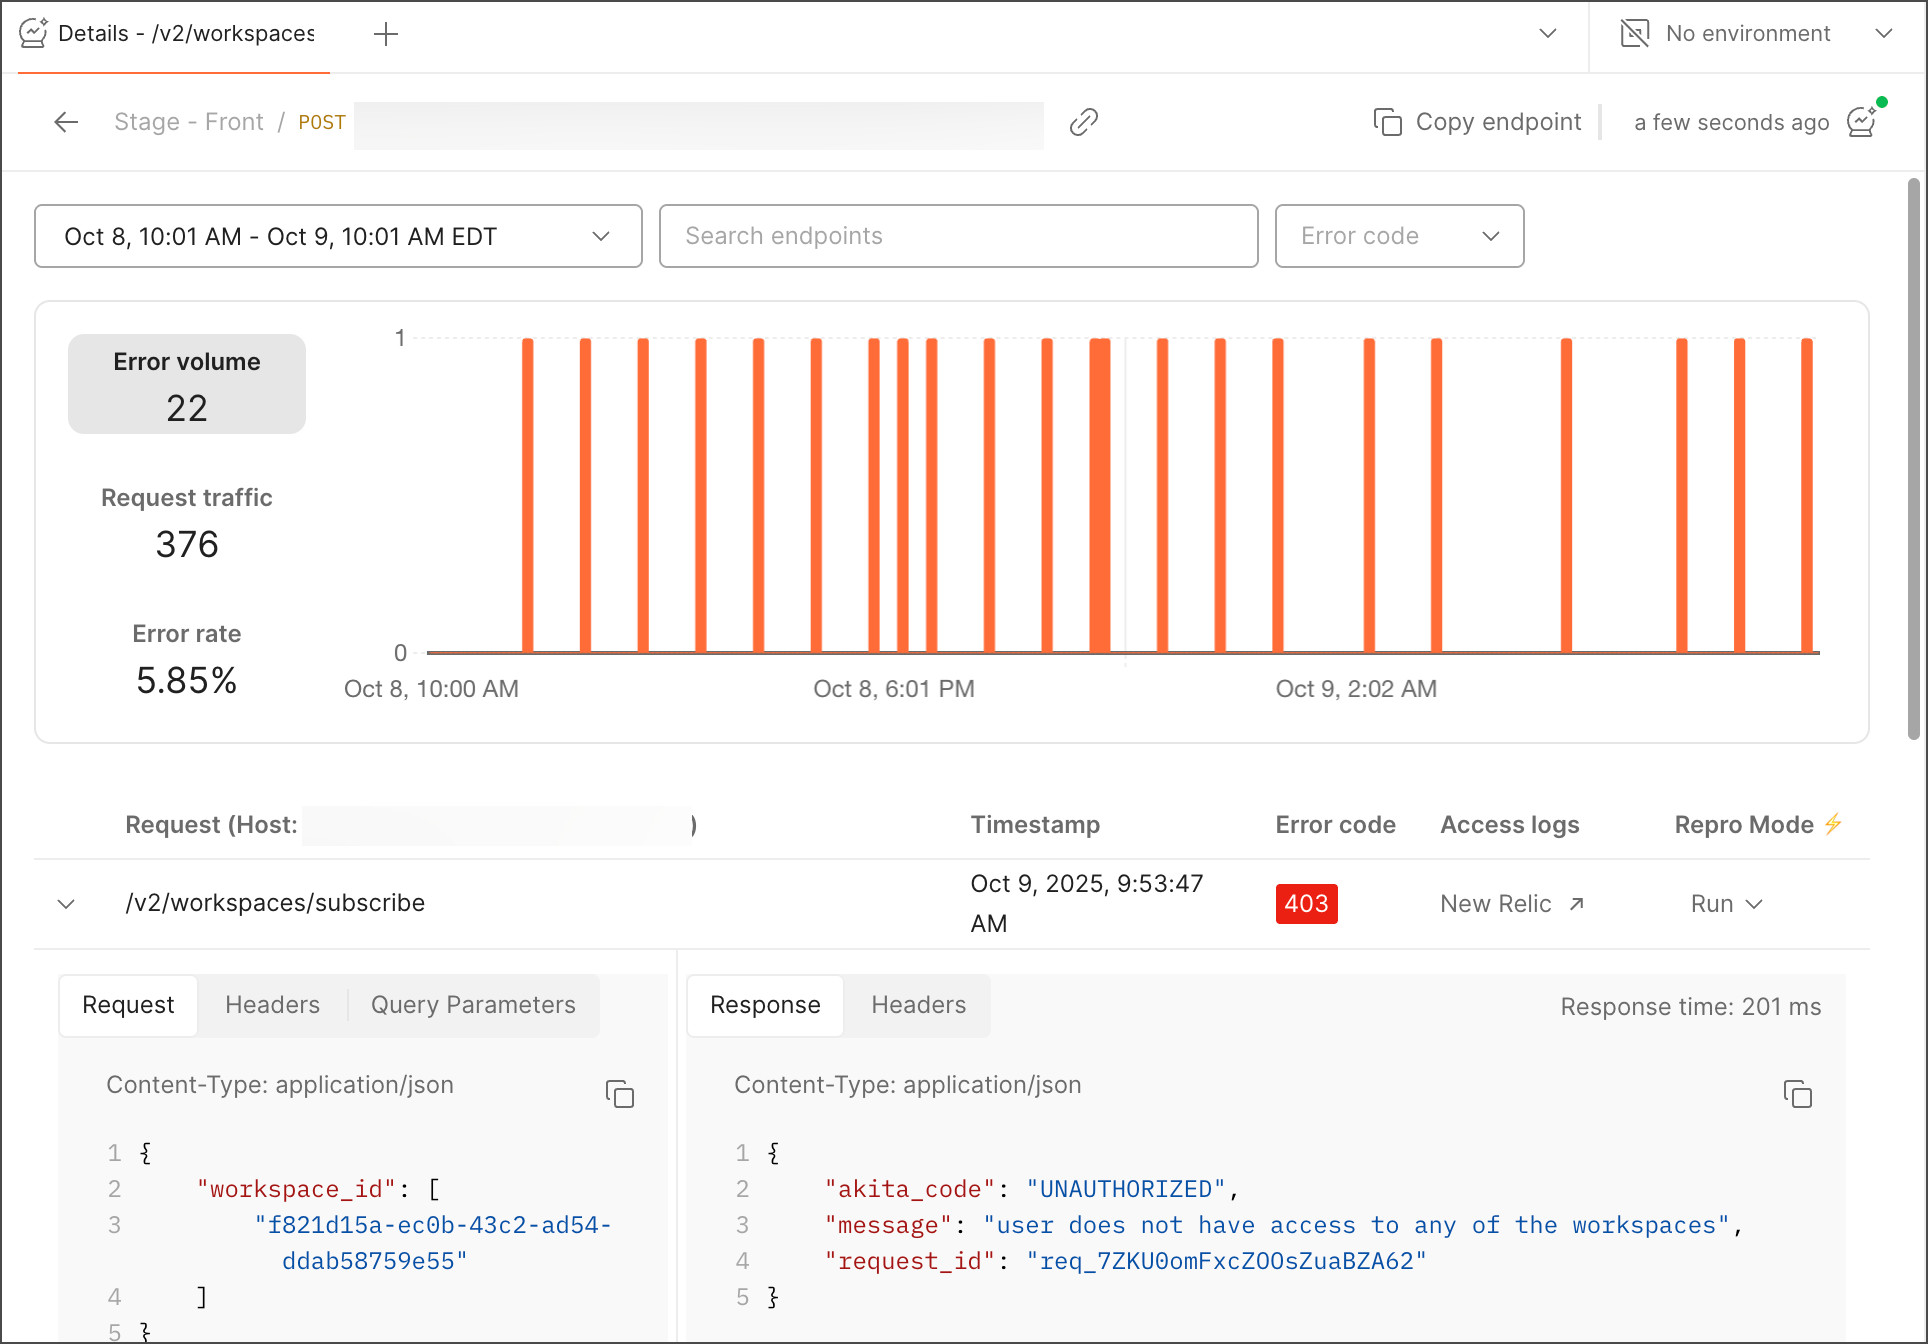
Select a failed request you want to inspect and reproduce. Then, expand it to observe the endpoint details such as request, headers, response, and query parameters, if any.
-
Click Run to open Postman’s request builder.
-
Click Send to reproduce the error.
-
In the response pane, select Save as example to capture the error response.
Known limitations of Repro Mode
As the Postman Insights team continues to improve automation around Repro Mode, you may need to manually substitute values in the Repro Mode settings. Known instances of this requirement include:
-
URLs and authorization.
-
Redacted sensitive values, like keys.
-
Resources that do not exist in pre-production environments, for instance, collection IDs and user IDs.
Debugging in different environments
In-app support for this feature is coming soon.
If, for example, you choose to debug a specific error, you can try to run the request in different environments or using Bifrost. Suppose you choose to use a beta environment to replicate your 403 error. If you try to send it, you might get User not found, and the reason can be that the user token is missing. You can paste the access token of your beta environment and replicate the issue.