Scale runners in your restricted network
This feature is available on Postman Enterprise plans. For more information, see the pricing page.
Properly scaling runners in your internal network helps keep them reliable and available. Because runners poll Postman for monitor runs, under-provisioning can cause delays while over-provisioning can increase costs. Using metrics, such as the number and age of monitors waiting to run, can help you scale your runners appropriately and maintain consistent performance.
About scaling runners
Postman identifies a runner by its ID, and the runner uses its ID and key to authenticate with Postman. Any runner started through the Postman CLI using the same ID and key is an instance of that runner. Each instance runs in the background and polls Postman for monitor runs.
Increase or decrease the number of runner instances to change the number of pollers available to run monitors. To determine whether you need to scale a runner, you can use the following metrics:
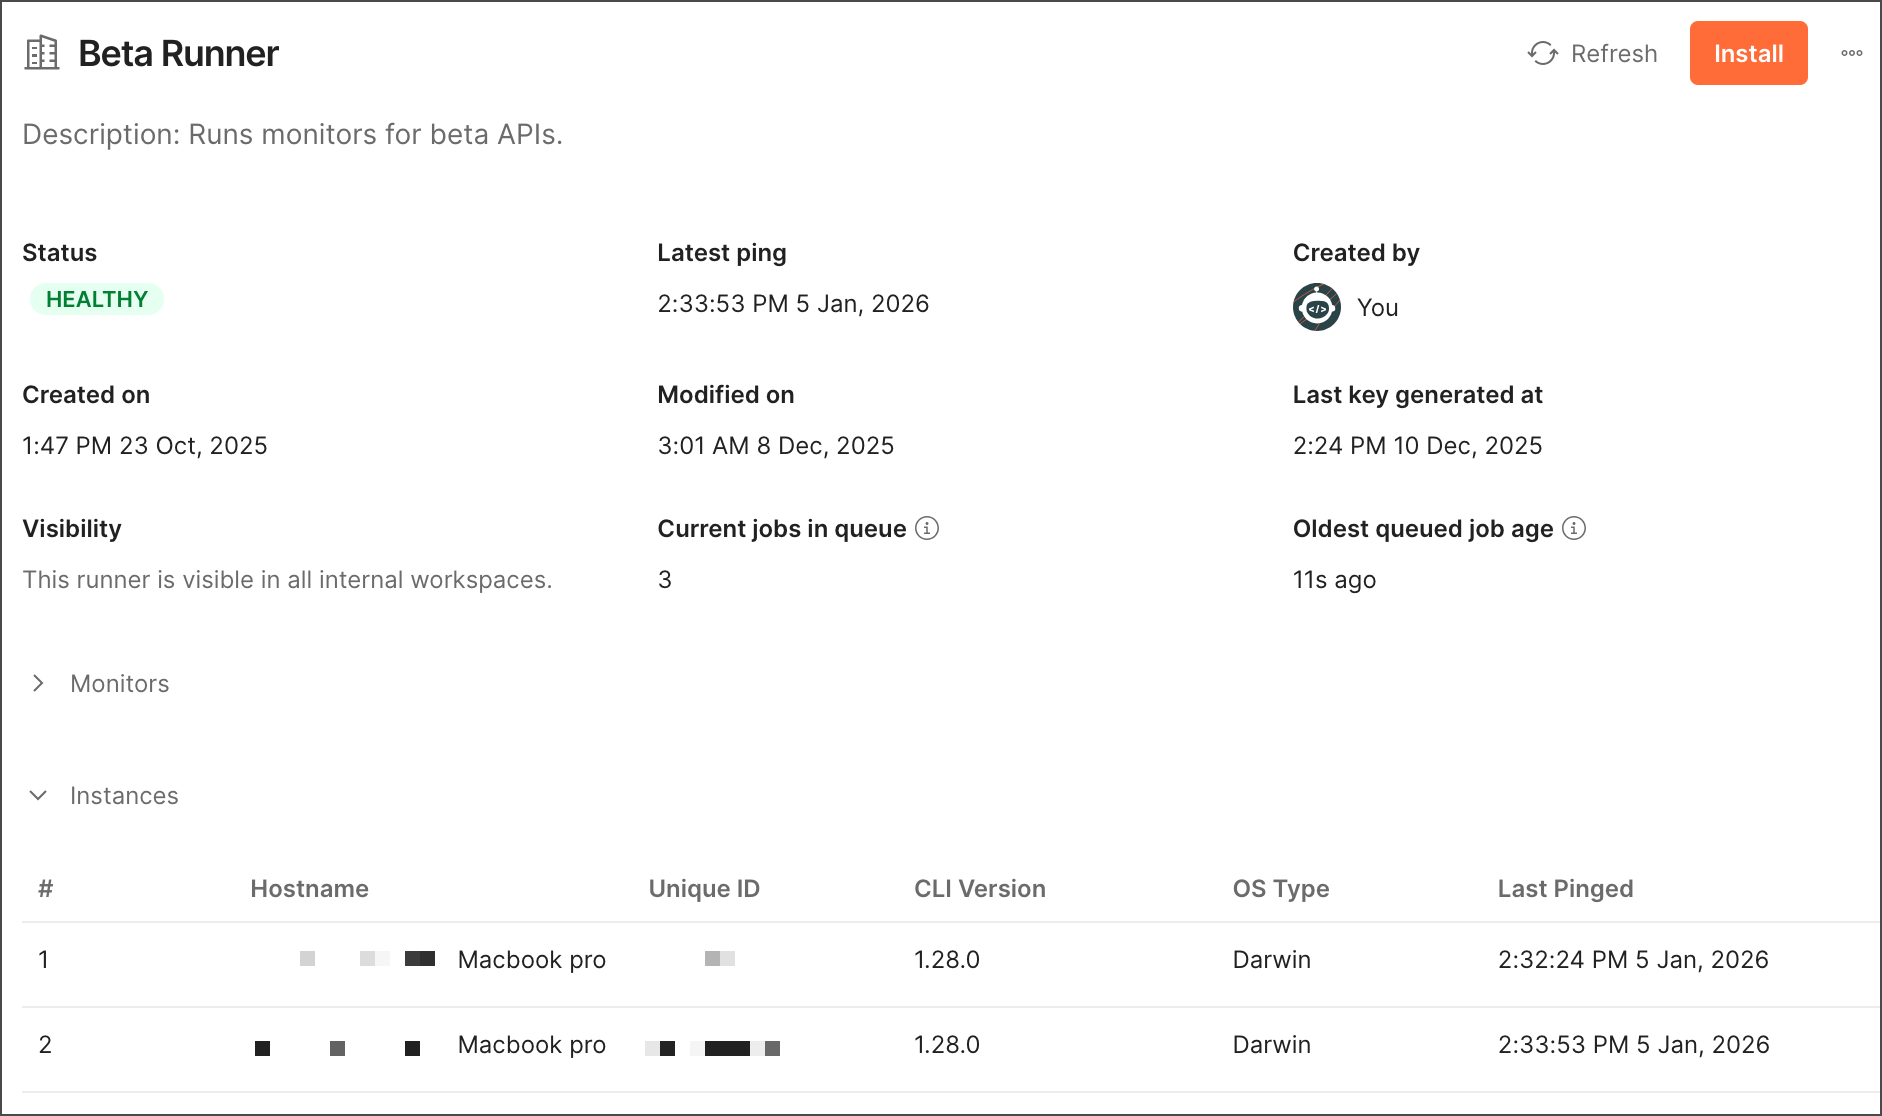
- Current jobs in queue - This metric returns the number of monitors waiting to run in the runner. For example, if there are usually around zero monitors waiting to run, this could indicate that runner instances are often inactive. You may want to remove runner instances in this scenario because you may have more than you need.
- Oldest queued job age - This metric returns the oldest age of the monitor (in seconds) that’s been waiting the longest to run in the runner. For example, if the age of the monitor keeps increasing, this could indicate monitors are waiting longer than expected to run. You may want to add more runner instances in this scenario to allow more monitors to run in parallel.
You can view all runner instances and their detailed metrics from Runner settings or use the Postman API.
You can also autoscale your runners with the Postman API using an orchestration system, such as Kubernetes, to maintain consistent performance in real time.
Get runner metrics from Runner settings
As a Team Admin, you can view runner instances and detailed metrics from Runner settings. You can review each runner’s name, health status, last ping date, workspace visibility, creator, creation date, and modified date. Click a runner’s name to view all instances associated with it and the number and age of monitors waiting to run.
To learn more, see Manage runners from Runner settings.
Get runner metrics using the Postman API
Use the Postman API’s Runners API to list runner instances and get metrics you can use to scale runners. To learn more about the Postman API, see Integrate Postman into your development toolchain.
Use the GET /runners/{runnerId}/instances endpoint to list all instances for a runner. The response includes details for each instance, such as the last time it sent results to the Postman cloud.
Use the GET /runners/{runnerId}/metrics endpoint to get metrics to help you scale your runner. Metrics include the number (queueDepth) and age (oldestQueuedRunAgeSecond) of monitors waiting to run.
Tip
To learn how to get a runner ID, see Manage runners for internal APIs.
Autoscale runners using the Postman API
With the Postman API’s Runners API, you can use the GET /metrics endpoint to get metrics like the number and age of monitors waiting to run. You can use these metrics with an orchestration system, such as Kubernetes, to autoscale your runners appropriately and maintain consistent performance in real time.
Note
Requests to this API aren’t billed.
By default, the GET /metrics endpoint returns the response in JSON format. You can add the Accept: text/plain header to return the response in the Prometheus exposition format. This can be scraped by Prometheus and other monitoring systems that support this format.
Example GET /metrics endpoint response in Prometheus exposition format:
In an orchestration system, use an autoscaling component to consume these metrics and scale your runners in real time. For example, if you’re using Kubernetes as your orchestration system, you can use these metrics with Horizontal Pod Autoscaling (HPA) or KEDA.