Analyze gateway traffic and token usage
The Fabric Gateway Analytics shows gateway traffic, errors, and LLM token usage across a selected window, with Overview, MCP, and LLM tabs. Each tab supports protocol filters (Overview — All protocols, MCP, and LLM) and time ranges (one hour, 24 hours, 7 days, and 30 days).
To access Analytics, go to Observability > Analytics in the left sidebar.
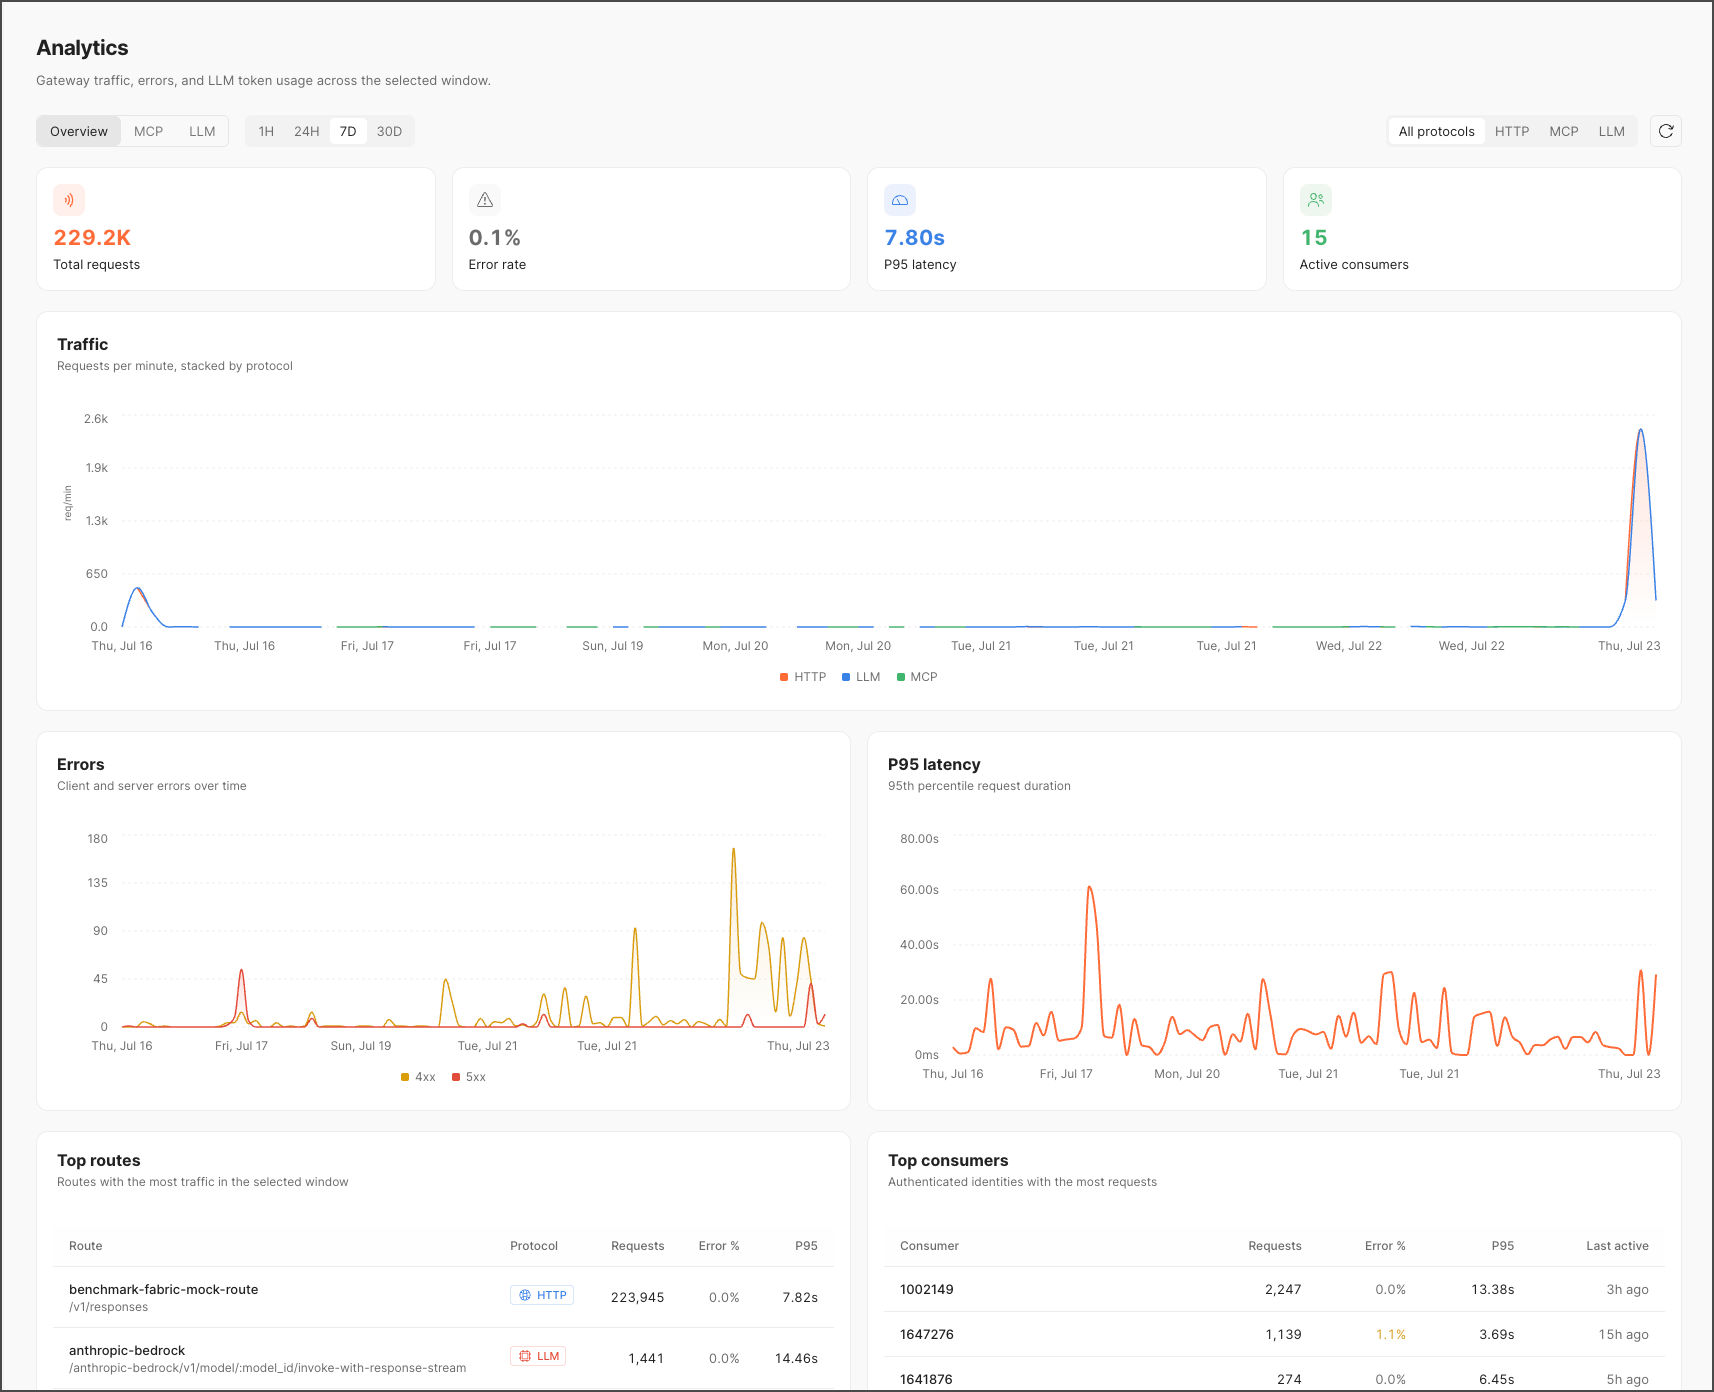
Overview
The overview surfaces the following metrics:
- Total requests, error rate, P95 latency, and active consumers.
- Traffic — Requests per minute by protocol.
- Errors — Client and server errors over time (4xx vs 5xx).
- P95 latency — 95th percentile request duration.
- Top routes — Routes with the most traffic in the selected window.
- Top consumers — Authenticated identities with the most requests.
MCP
MCP surfaces the following metrics:
- Total calls, error rate, P95 latency, and active consumers.
- Activity — Requests per minute by Tools, Resources, and Prompts.
- Top tools — Tools with the most calls in the selected window.
- Top consumers — Authenticated identities with the most calls in the selected window.
- Top routes — Routes with the most calls in the selected window.
- Top servers — Upstream MCP servers ranked by tool-call volume.
- Errors — Client and server errors over time (4xx vs 5xx).
- P95 latency — 95th percentile request duration.
LLM
LLM surfaces the following metrics:
- Total requests, total tokens, estimated cost, and error rate.
- Cost over time — Estimated spend per hour or model.
- Top models by estimated spend.
- Top consumers by estimated spend.
- Errors — Client and server errors over time (4xx vs 5xx).
- P95 latency — 95th percentile request duration.