Monitor gateway health
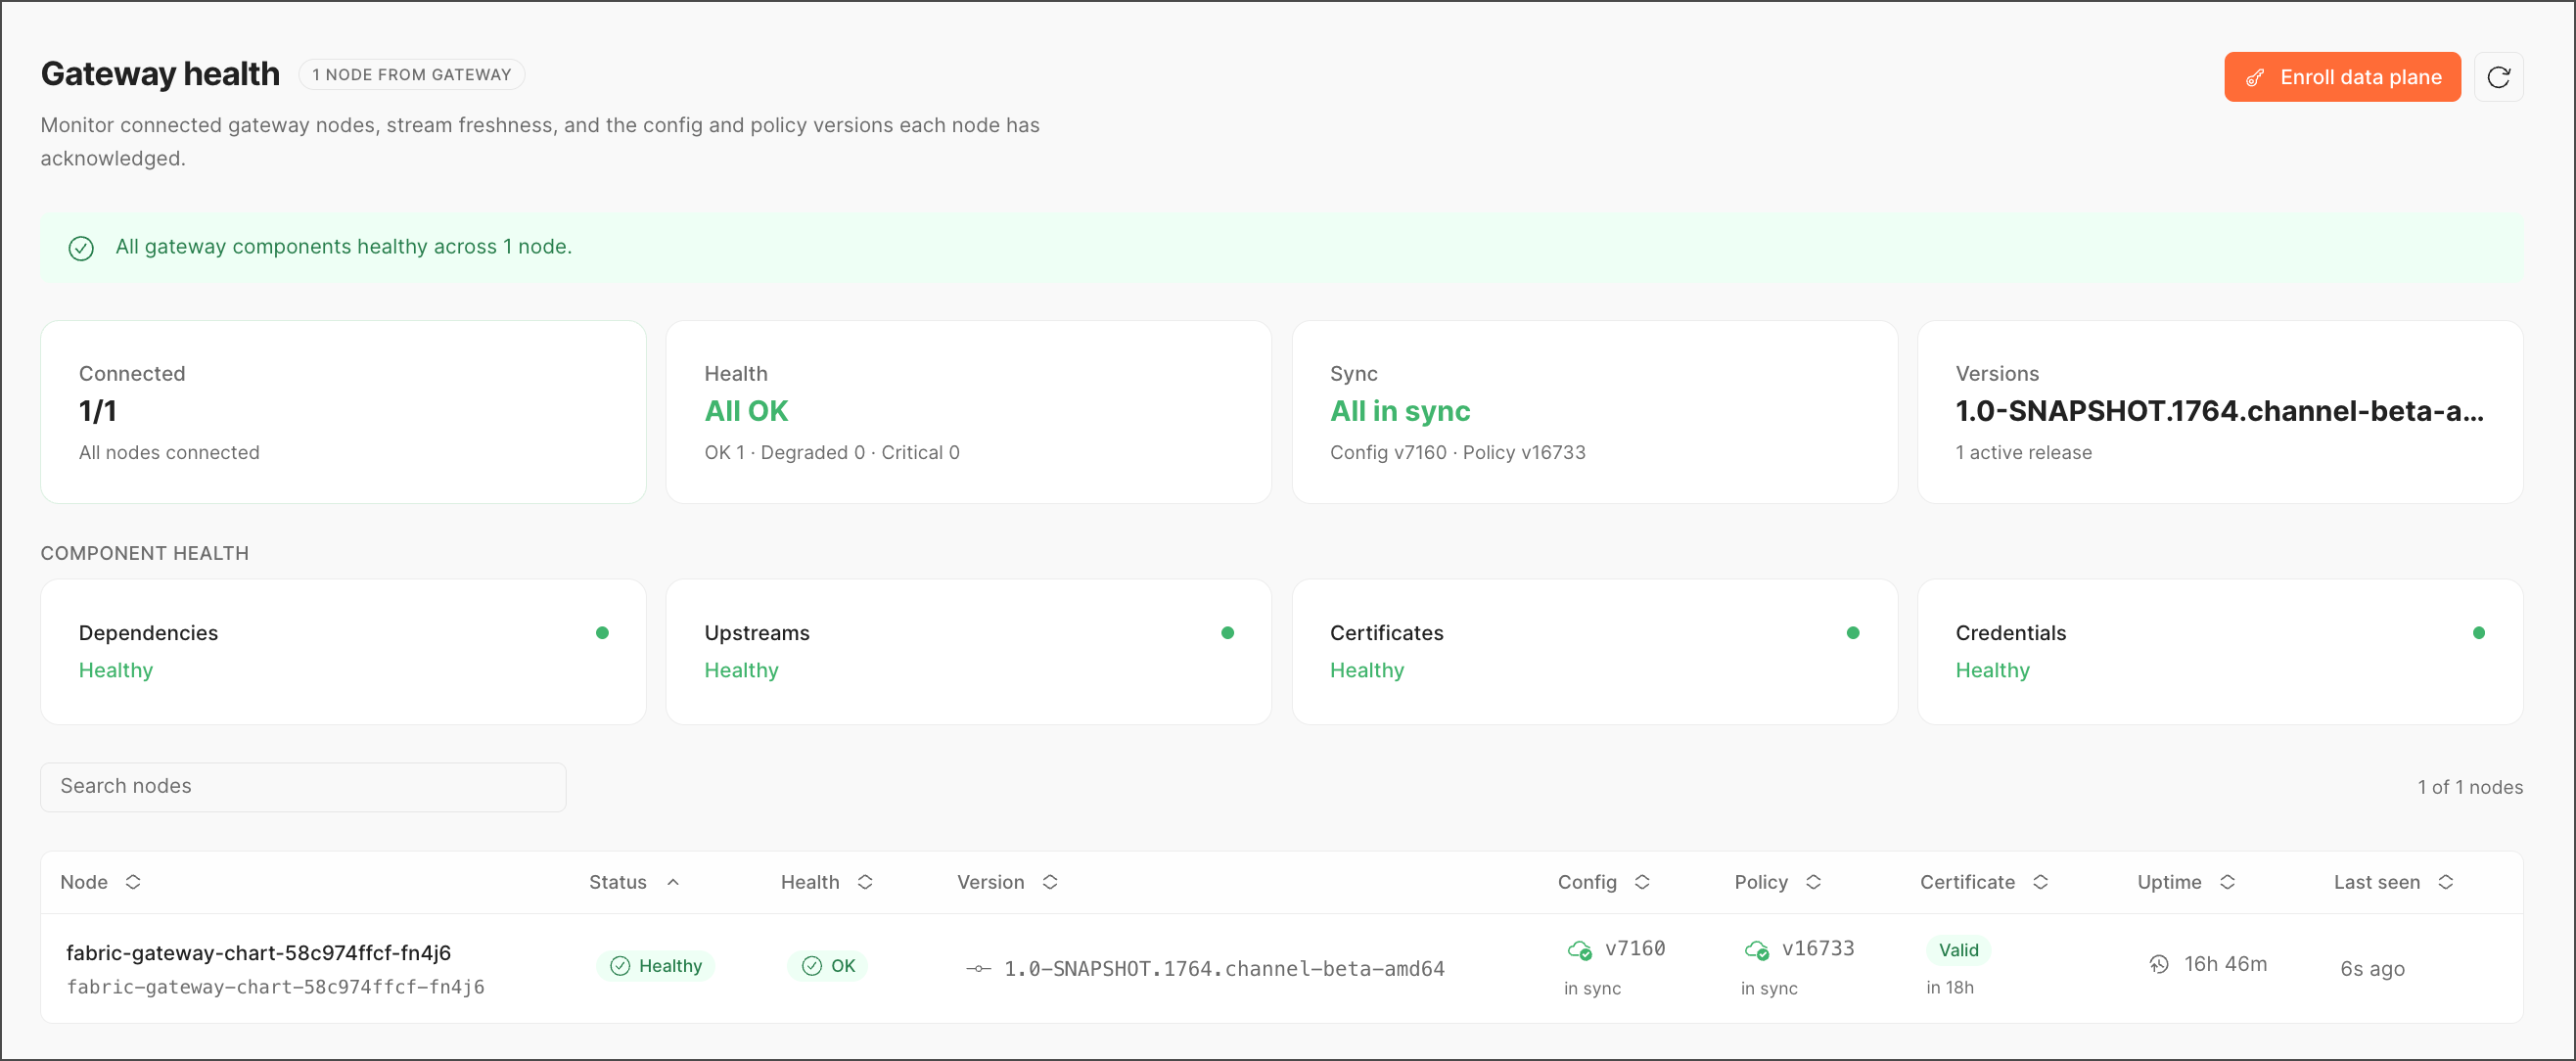
Gateway Health gives you a live, aggregate view of every data plane node connected to your AI Gateway. Check to see whether nodes are online, how healthy their dependencies are, and whether each one is running the config and policy version you expect. Use this page as your first stop when diagnosing a rollout issue, an unhealthy dependency, or a node that’s fallen out of sync.
Go to Observability > Gateway health in the left sidebar. The header badge shows how many nodes are currently reporting in.
Enroll a node
Click Enroll data plane in the top-right corner to register a new gateway node against this control plane. Use the refresh icon beside it to manually re-poll node status rather than waiting for the next automatic refresh.
Status banner
At the top of the page, a banner summarizes overall system health at a glance. This banner turns from green to a warning state if any connected node or component reports degraded or critical status, so you can tell whether something needs attention without reading the full table.
Summary cards
Four cards give you a top-level rollup across all connected nodes:
- Connected — How many nodes are currently connected out of how many are expected (for example,
1/1), with a note confirming all nodes are connected. - Health — An aggregate health status (
All OK), broken down into counts of nodes that are OK, degraded, or critical. - Sync — Whether connected nodes have acknowledged the latest config and policy versions (
All in sync), along with the current config version and policy version. - Versions — The gateway release version currently running and how many distinct active releases are in use across your fleet.
Component health
The Component health section breaks down health by subsystem rather than by node:
- Dependencies — Health of internal service dependencies the gateway relies on.
- Upstreams — Health of the upstream services your routes point to.
- Certificates — Validity of TLS certificates used by the gateway.
- Credentials — Health of stored credentials used for auth and upstream connections.
Each card shows a status indicator dot and a label (Healthy, Degraded, or Critical). A problem in any one of these categories is often the fastest way to explain a node-level issue you’re seeing lower on the page.
Node table
The bottom of the page lists every connected node individually. Use the Search nodes field to filter by node name in larger fleets. The counter in the top-right of the table reflects the current filter.
Each row includes:
Columns marked with a sort icon (Status, Health, Version, Config, Policy, Certificate, Uptime, Last seen) can be sorted by selecting the column header.
Tips
- If Sync shows a node out of sync, check whether a config or policy change was published without a corresponding rollout — the Config and Policy columns in the node table will show which version each node is actually running versus the target.
- A
DegradedorCriticalentry under Component health is usually the fastest lead when a node’s overall Status looks unhealthy. Check dependencies, upstreams, certificates, and credentials before digging into node-specific logs. - Use Enroll data plane when standing up a new node so it starts reporting into this view immediately.