Review gateway audit logs
Audit Logs give you a complete, filterable record of every configuration change and administrative action taken against your AI Gateway, alongside LLM token usage metering. Use this page when you need to answer “who changed what, and when” for compliance and incident investigation, or “how much are we spending on model traffic” for cost and usage tracking.
To manage your audit logs, go to Observability > Audit logs in the left sidebar.
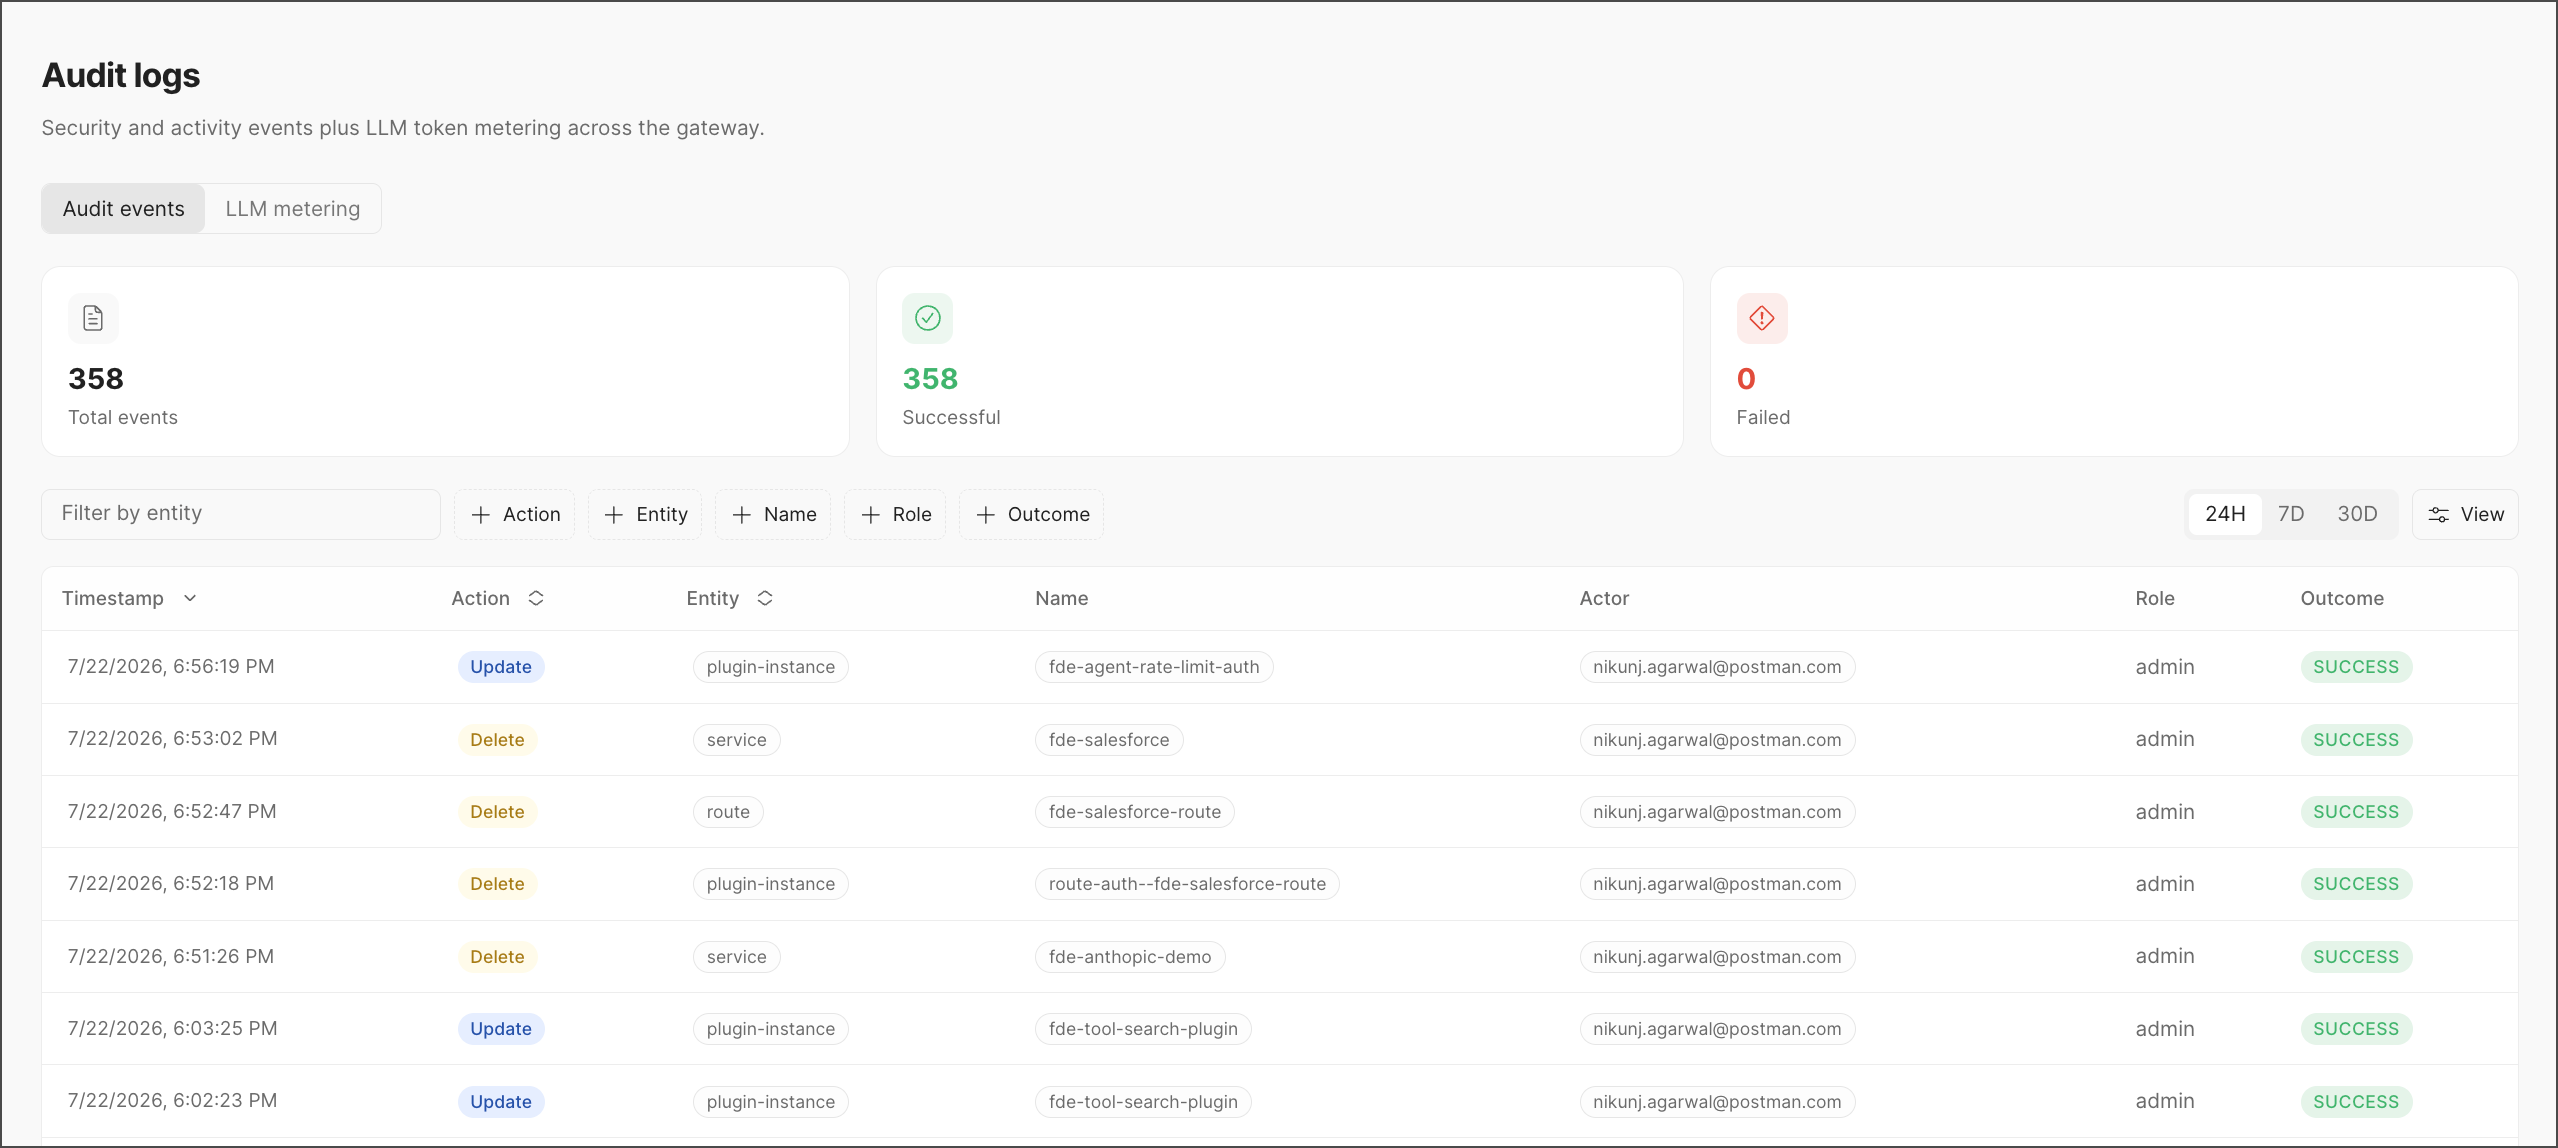
You can use the following views:
- Audit events — A chronological log of security and administrative activity (creates, updates, deletes) across gateway resources.
- LLM metering — Token usage and cost tracking for LLM traffic passing through the gateway, broken down by provider and model.
Audit events
Audit events controls the display and filtering of security and administrative activity logs.
Observe overall activity
Observe summarized activity over the current time window:
- Total events — The total number of audit events recorded.
- Successful — The number of those events that completed successfully, marked with a green check.
- Failed — The number of events that failed, marked with a red warning icon. A non-zero value here is usually the first thing worth investigating.
Filter events
Use the Filter by entity search box to narrow the log to a specific resource by name. Additional filter buttons let you refine further:
- Action — Filter by operation type (Create, Update, Delete).
- Entity — Filter by resource type.
- Name — Filter by the specific resource name.
- Role — Filter by the role of the actor who performed the action (for example, admin).
- Outcome — Filter by result (success or failure).
Control the time range using the 24H/7D/30D toggle in the top-right of the filter bar. Use View to adjust which columns are displayed in the table.
Analyze events
Each row represents a single audit event:
The Timestamp, Action, and Entity columns can be sorted by selecting their headers.
Example use cases
- Trace a
Deleteon a service and its dependent route back to a single actor and timeframe. - Spot a repeated
Updateevents on the same plugin instance in a short window, which can indicate a config was being iterated on live rather than tested beforehand. - Spot a spike in the Failed count as your signal to filter by Outcome and investigate which actions aren’t completing successfully.
LLM metering
LLM metering tracks token consumption and cost across all LLM traffic flowing through the gateway, broken down by provider, model, and time period.
Filter the data
Use the following filters and controls to analyze LLM metering data:
- 24H/7D/30D — Time range toggle for the whole tab.
- Day · Provider · Model — Grouping selector, controlling how rows in the breakdown table below are aggregated.
- All providers — Filter to a specific LLM provider.
- User, Model, Trace ID, Session ID — Free-text filters for narrowing metering data to a specific caller, model, or request trace.
Observe overall activity
Observe the summarized usage over the selected time range:
- Total tokens — Combined input and output token count, with the input/output split.
- Requests — Total number of LLM requests, with the number of grouped rows in the breakdown table.
- Cache read — Tokens served from cache.
- Cache creation — Tokens written to cache.
Analyze token trends
A line chart plots Input, Output, and Cache token volume over time, letting you spot spikes or shifts in usage pattern. For example, a sudden rise in cache tokens suggests increased reuse of cached context, or an input spike points to larger prompts being sent.
Analyze the data breakdown
Observe metering data at a granular level. Analyze it by the following breakdown:
Tips
- Use the Model and Provider filters together to isolate cost and usage for a single model rollout — Useful when comparing spend across model versions.
- A high Cache read relative to Input suggests your prompt caching strategy is working well and reducing redundant token spend.
- Cross-reference spikes in the Token trend chart with Audit events for the same time window — A config or plugin change (like a new route going live) often explains sudden usage shifts.