Inspect gateway traces

View as Markdown

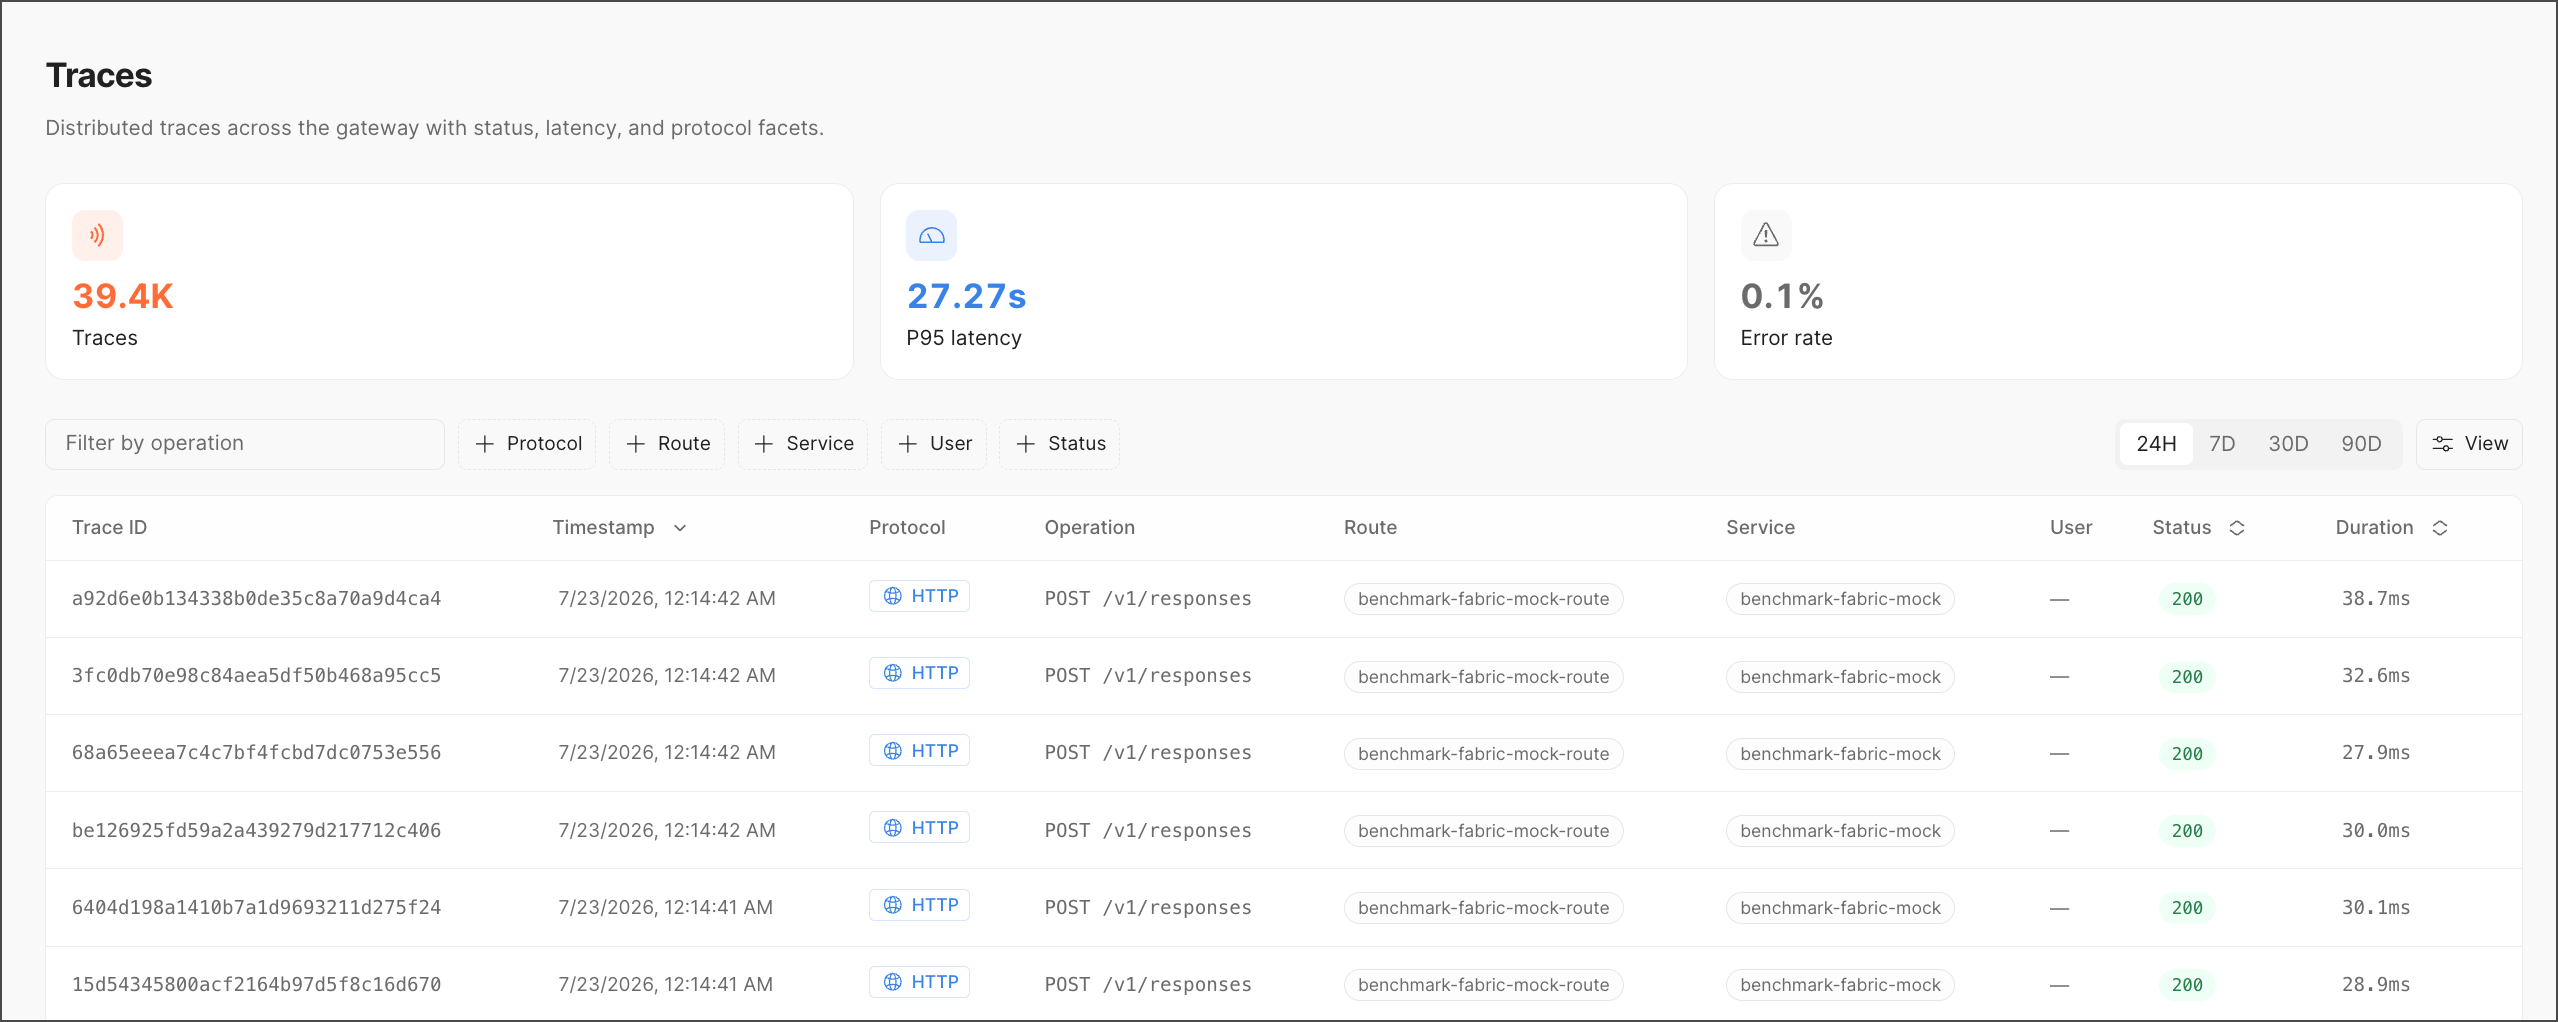
The Fabric Gateway Traces page provides a list view of distributed traces captured across the gateway, with filters for protocol, route, service, user, and status. It’s the primary entry point for identifying anomalies, such as elevated latency, failing routes, or authentication errors. Drill into an individual trace for a detailed breakdown.

To manage the trace list, go to Observability > Traces.
Gateway traces

Summary metrics

Traces displays the following summary metrics, calculated over the selected time range:

MetricDescription
TracesTotal number of traces recorded in the selected time range.
P95 latencyThe 95th percentile of trace duration. 95% of traces in the selected time range completed faster than this value. The P95 is used instead of an average so that a small number of unusually slow requests do not obscure typical performance.
Error rateThe percentage of traces in the selected time range that returned a non-2xx status.

Time range

Use the time range toggle (24H, 7D, 30D, 90D) to control the window over which summary metrics and the trace list are calculated.

Filters

The filter bar allows the trace list to be narrowed using the following criteria:

FilterDescription
Filter by operationFree-text search on the operation name, such as a model identifier or route path.
ProtocolRestricts results to a specific protocol, such as LLM or MCP.
RouteRestricts results to traces that matched a specific gateway route.
ServiceRestricts results to traces handled by a specific backend service.
UserRestricts results to traces associated with a specific user or consumer ID.
StatusRestricts results to traces with a specific response status.

Trace list

Each row in the table represents a single span or operation captured within a trace. A single trace (identified by one Trace ID) may appear as multiple rows if it contains multiple recorded operations.

ColumnDescription
Trace IDThe unique identifier for the trace. Selecting a Trace ID opens the detailed view for that trace, including its full span hierarchy and attributes.
TimestampThe date and time the trace, or the operation within it, was recorded.
ProtocolThe protocol associated with the operation. Common values include LLM for model/chat completion calls and MCP for Model Context Protocol tool calls.
OperationThe specific action performed, such as a chat completion against a named model or an HTTP method and path for a tool call.
RouteThe gateway route that the request matched.
ServiceThe backend service associated with the matched route.
UserThe user or consumer ID associated with the request.
StatusThe response status code. Status values are color-coded: successful responses (2xx) are shown in green, and client error responses (4xx, such as 401 or 403) are shown in yellow or orange.
DurationThe total time the operation took to complete.

Typical uses

You can use the trace list to do the following:

  • Identify slow requests — Sort or scan by Duration to find operations approaching or exceeding the P95 latency shown in the summary metrics.
  • Detect failing routes or users — Repeated non-2xx status codes for a given Route or User can indicate a misconfiguration, expired credential, or authentication issue.
  • Compare protocol performance — Because LLM and MCP operations differ significantly in expected duration, filtering by Protocol helps establish a meaningful baseline before flagging an operation as anomalous.
  • Investigate a specific trace — Once a trace of interest is identified, select its Trace ID to open the full trace view, which shows the complete span hierarchy, per-span duration, and span-level attributes.