Debug policy behavior with Explain
The Explain tool lets you simulate a request against your gateway configuration and see exactly how policy evaluation would play out. You can check which plugin instances would run, in what order, which ones would be skipped and why, and any warnings raised along the way, without sending traffic to an upstream service.
Use Explain when you’re debugging why a request was allowed or blocked unexpectedly, verifying a new plugin instance behaves as intended before it goes live, or working out why two plugins seem to be conflicting on the same route.
Go to Policies > Explain in the left sidebar. The page is split into two panes: a request builder on the left, and a results panel on the right that populates once you run a simulation.
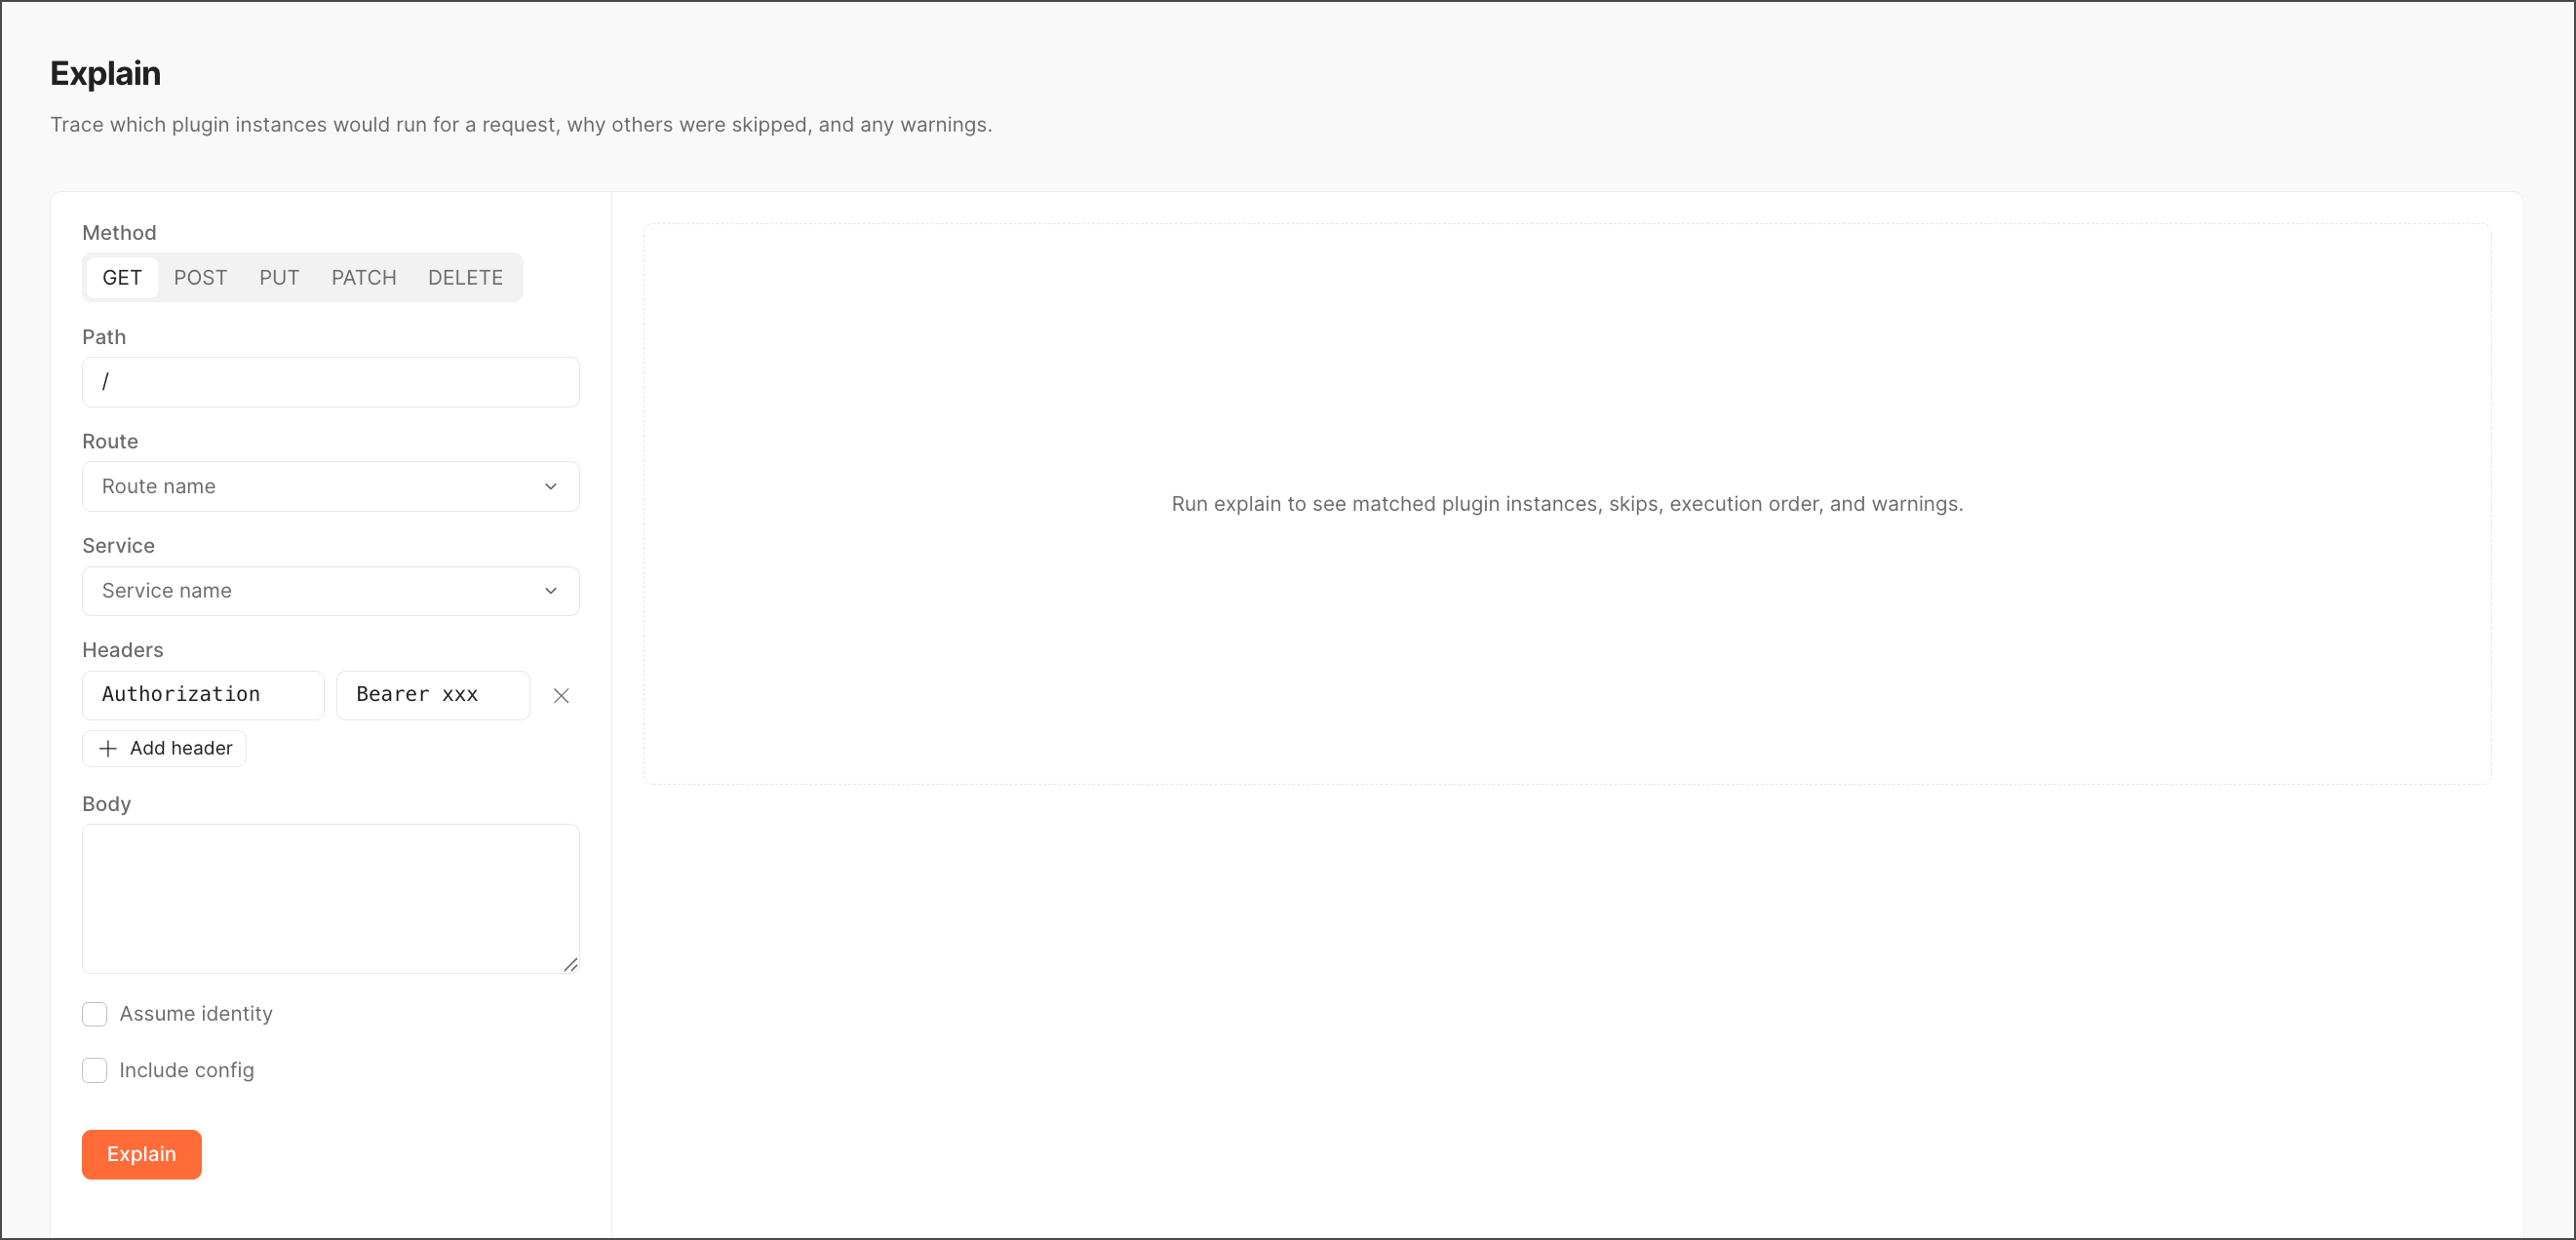
Build a request
The left pane lets you construct a synthetic request that mirrors what a real caller would send:
- Method — Choose the HTTP method to simulate:
GET,POST,PUT,PATCH, orDELETE. - Path — The request path to evaluate against your routes.
- Route — Optionally, select a specific route by name from the dropdown. If left blank, Explain resolves the route the same way the gateway would at runtime, based on path and method.
- Service — Optionally, select the upstream service the route points to, useful when a route can resolve to more than one service.
- Headers — Add one or more header key/value pairs (for example
Authorization: Bearer xxx) using the Add header button. This is how you simulate authenticated as opposed to unauthenticated calls, or trigger auth-capable plugins. - Body — An optional request body, for simulating
POST/PUT/PATCHpayloads that body-inspecting plugins might read.
Two additional options refine what the simulation takes into account:
- Assume identity — When enabled, Explain evaluates the request as if it were made by a specific consumer identity, letting you test identity-dependent plugins (like Access Control or Agent Approval) without a real credential.
- Include config — When enabled, the results panel includes the resolved configuration values for each matched plugin instance, not just whether it ran.
Once you configure your request, click Explain to run the simulation.
Read the results
After running the simulation, the results panel populates with a trace of the evaluation, typically including:
- Matched plugin instances — Every plugin instance that applies to the simulated route/service, in the order they ran.
- Skipped instances — Plugins that were configured but didn’t run for this request, along with the reason (for example, phase mismatch, scope exclusion, disabled instance).
- Warnings — Non-fatal issues surfaced during evaluation, such as a plugin reading a field that wasn’t present in the simulated request.
Tips
- Use Explain alongside the Plugin catalog — If a plugin isn’t behaving as expected, check its
readsandphasescontract in the catalog, then confirm against what Explain reports for your simulated request. - Combine Assume identity with different header values to test how identity-dependent governance plugins (like Access Control or Agent Scope Gate) respond to different consumers without needing real credentials.
- If you’re chasing down a request that’s unexpectedly blocked in production, cross-reference Explain’s output with Audit logs for the real request to confirm the simulation matches actual behavior.