Customize your Postman Insights
The Postman Insights Agent observes your API traffic to automatically populate your endpoints inside your Insights project. You can customize your project to pinpoint, monitor, and troubleshoot the endpoints you’re most interested in.
You can redact your data before you rerun requests to your endpoints. You can show or hide the endpoints filtered out by the Insights Agent. If the Postman Insights AI didn’t get your endpoints right, you can also give path hints to improve the inference. To monitor a set of endpoints of your choosing, you can select and save them to a Postman Collection.
Redact your own data for Repro Mode
When rerunning requests in Repro Mode, Postman Insights automatically redacts a set of sensitive values, including authentication tokens. See the full list. You can redact your own fields before you turn on Repro Mode or for the data you receive going forward.
To redact your own data, do the following:
-
In the Settings tab, under Fields to redact, use either of the following options:
- Match a field name, and redact anything that’s present in such a field.
- Match the data using a regular expression, and redact anything that matches that regular expression.
To redact more than one value, enter each expression on a separate line.
-
Click Save to apply your options.
You can redact data at any time for both new and existing Insights projects. Edits don’t apply retroactively to the stored data. However, the displayed payloads take the new settings into account immediately, if they’re more restrictive.
When matching data is found, it will be replaced with the string *REDACTED*.
Show or hide your filtered endpoints
Insights observes all API traffic, including API calls you may not be interested in.
By default, Insights filters the following endpoints:
-
IP-host addresses — These are API calls that have an IP host where the
postman.compart is usually found. -
Health checks — These are API calls to
/healthzand similar endpoints used for pinging the health of a service.
For example, you may want to view these endpoints in the following cases:
- The Insights service is getting your traffic, but all API calls are filtered out.
- You’re getting errors on IP host or health check endpoints.
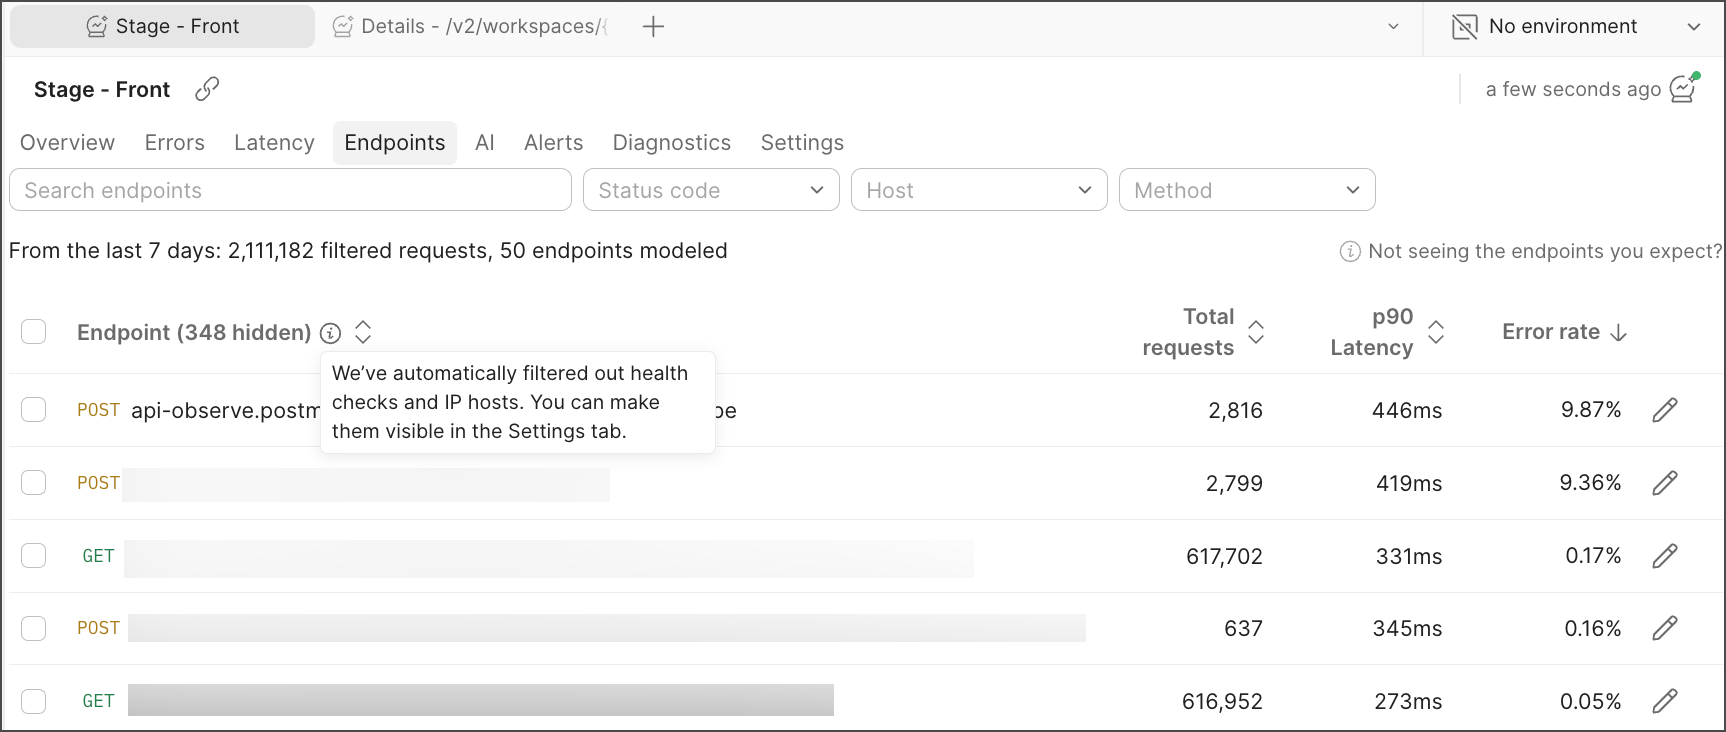
To show IP host and health endpoints, go to the Settings tab, and toggle on IP hosts & health checks.
When this option isn’t turned on, Postman displays the number of hidden endpoints in the Errors, Endpoints, and Alerts tabs.
Edit path parameters
As Postman Insights watches your API traffic, it’s automatically finding the dynamic parts of API paths and replacing them with path argument variables. However, the Insights AI doesn’t always get things right, and you may have to give some hints.
To edit a path parameter, do the following:
-
In your Insights Project, select the Endpoints tab.
-
Click
 Edit path parameters next to the endpoint you want to edit.
 -
From the dropdown list, select the component to edit.

-
Give the component a name, which automatically displays as a variable in the endpoint.
-
Specify the parameter values. You can select the types of characters the parameter can include or, for better precision, specify a string by entering regular expressions. Make sure to press Return or Enter after each expression. Values that will and won’t be included appear at the bottom.

-
Click Next to review any exceptions you want to use to avoid merging specific values into the parameter, for example, if you want to watch a specific endpoint separately.
-
Click Confirm to apply the change. The timeline is recomputed, and the API model applies the new rule to future traffic.

Add endpoints to a collection
Adding your endpoints to a collection enables you to keep track of a specific set of endpoints. Before you decide to save endpoints to a collection, take a look at the endpoint details to help you make a selection. To learn more, see Explore your endpoints.
To curate your endpoints, do the following:
-
In your Insights Project, select the Endpoints tab.
-
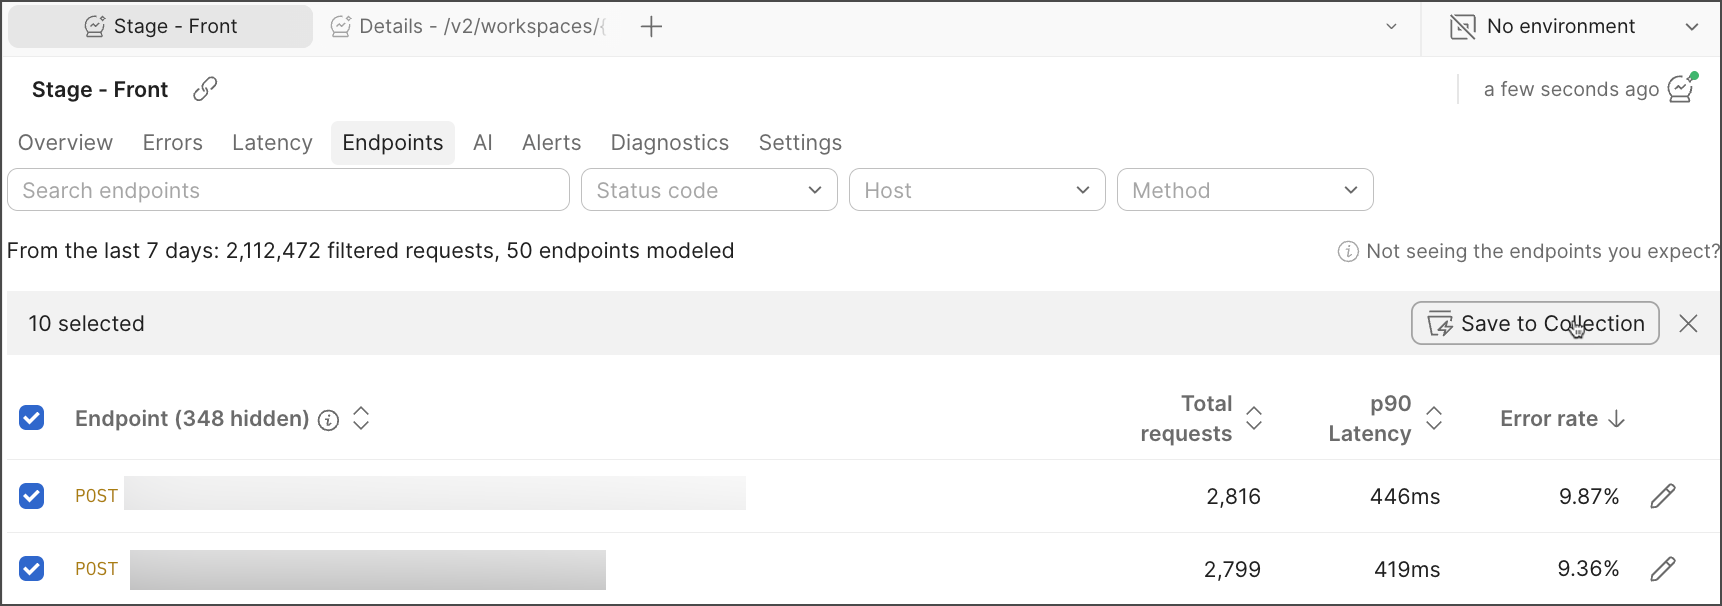
Find endpoints that you would like to monitor and add them to a curated collection. For example, select all endpoints by a specific host and click Save to Collection.
-
Add the selected endpoints to an existing curated collection or create a new collection. Click Add.

-
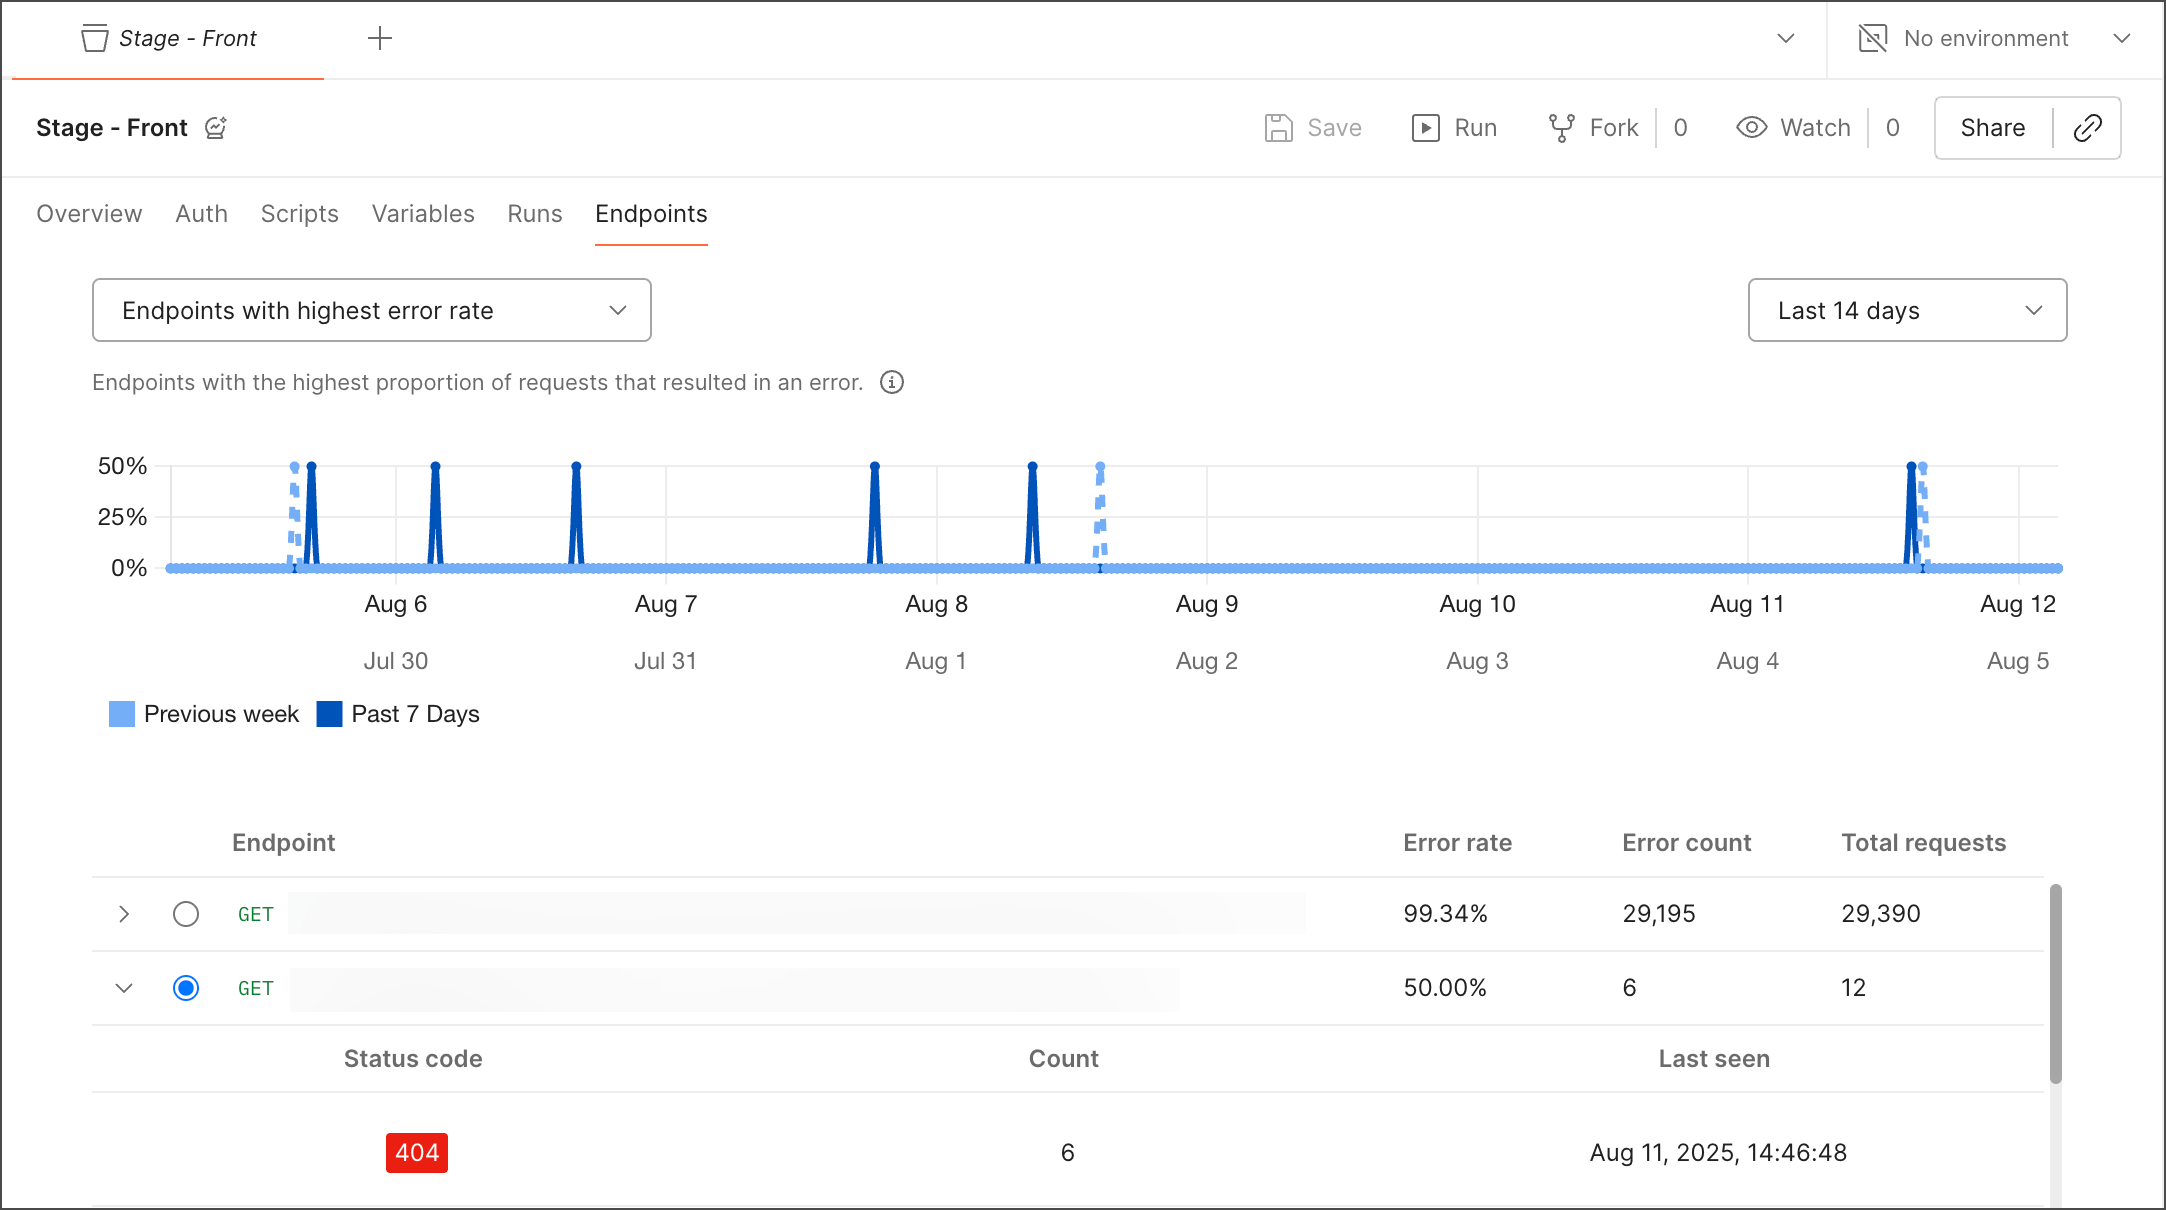
Access your curated collection and check the Endpoints tab.
To explore and debug your endpoints, see Debug with Insights.