Configure and validate performance tests using the Postman CLI
With performance tests, you can simulate user traffic and observe how your API behaves under load. Using the Postman CLI, you can run performance tests for Postman Collections from your local machine or your CI/CD pipeline. By default, the load comes from the machine that runs the command. Use the --runner option to originate the load from Postman’s managed cloud infrastructure instead. This enables your team to automatically detect performance regressions during development and deployment workflows.
The postman performance run command runs a configured performance test for a collection and makes the results available in Postman. You can use the command to validate performance tests locally, automate them in your CI/CD pipeline, and compare test results across runs to identify performance regressions.
To use the postman performance run command, sign in to Postman with the postman login command.
You can configure a performance test and copy the postman performance run command in either the Postman desktop app or the Postman web app. The App run method, which generates load from the machine running Postman, is available in the desktop app only. Learn more about where to run a performance test.
Prepare a collection for performance testing
Before running a performance test with the Postman CLI, prepare a collection that represents the API traffic you’d like to test. You can create a new collection for performance testing, or reuse an existing collection and modify it for load testing scenarios.
When preparing your collection, choose requests that reflect real API usage patterns and critical workflows. For example, you may want to include commonly used endpoints, authentication flows, or requests that are sensitive to latency and throughput. You can also add pm.test() assertions to validate response status codes, response times, and other performance-related behaviors during load testing.
You can also use Agent Mode to generate a collection for performance testing. For best results, describe the API workflows, endpoints, variables, and assertions you’d like to include in the collection.
For example, you can ask Agent Mode the following:
Create a collection for performance testing
Create a Postman Collection for performance testing an e-commerce API. Include realistic user workflows for product search, product details, user authentication, cart operations, and checkout. Use collection variables for the base URL and authentication token, avoid destructive requests, and add pm.test() assertions for response status codes and response times.Generate the CLI command and run tests locally
After preparing your collection, configure the performance test in Postman and generate the Postman CLI command. You can run the command locally first to make sure the performance test works as expected before adding it to your CI/CD pipeline.
-
Click the
 Items tab in the sidebar.
 -
Click Collections, then select the collection you’d like to run a performance test for.
-
Click
 Run.
Run. -
Click the Performance tab.
-
Under Run method, select Postman CLI.
-
Configure the load profile, virtual user count, and test duration.
-
Optionally, under Iteration data, select a dataset and view to use as test data. A dataset works the same way no matter where the
postman performance runcommand runs. This makes it a good choice for CI/CD or any machine other than the one you used to configure the test.Alternatively, you can use a data file instead of a dataset. Make sure the file path exists on the machine that will run the command. The option to select a data file is available in the desktop app only. However, selecting a file isn’t reflected in the generated command shown in the app. Copy the generated command and add the file path using the
--data-fileoption. Learn more about the--dataset-idand--data-fileoptions. -
(Optional) Configure a pass/fail condition for the performance test. This determines whether the performance test passes or fails based on metrics such as percentile response times. If you skip this step, the command always exits with code
0regardless of the results. Configure a condition if you’re using this in a CI/CD pipeline to catch performance regressions. -
Under Install Postman CLI, click
 Copy to clipboard to copy the installation command and run it in your terminal, or click Install in Terminal to run it directly.
If you’re using the Postman desktop app, the Install Postman CLI section doesn’t appear, because the desktop app includes its own Postman CLI. If you’re using the Postman web app, this section always appears. If you need the installation command anyway, see Install the Postman CLI.
-
Under Run the performance test, click Add API key. Do one of the following:
- Click Generate key to create a new API key. Enter a name for the API key and click Generate. Click Copy to copy the key and save it somewhere safe.
- Click Use existing key and enter a valid API key.
- Click Generate key to create a new API key. Enter a name for the API key and click Generate. Click
-
Click Insert key.
-
Click
 Copy to clipboard to copy the
 loginandperformancecommands and run them in your terminal, or click Run in Terminal to run them directly.
The generated commands include the postman login command and the postman performance run command. For example:
While the test is running, you can view performance metrics in real time from the terminal. To learn how to view performance test results in the Postman app during and after the test run, see View results in Postman.
Run performance tests in your CI/CD pipeline
After you verify that the performance test runs locally, add the postman performance run command to your CI/CD pipeline. This enables your team to run performance tests automatically when changes are pushed to your repository, and to run them unattended on a schedule.
The following example uses GitHub Actions to install the Postman CLI, authenticate with Postman, and run a performance test. The workflow runs on every push and pull request to main. It also runs on a daily schedule, so you can track your API’s performance over time without anyone starting the run. The collection ID is stored as a GitHub Actions variable, and the Postman API key is stored as a GitHub Actions secret.
After adding the workflow file to your repository, commit and push your changes. GitHub Actions starts the workflow and runs the performance test with the Postman CLI. You can use performance tests to prevent deployments that don’t meet your performance requirements. In this example, if the performance test exceeds the configured --pass-if threshold, postman performance run exits with code 1 and the CI/CD workflow fails. A run that meets the threshold exits with code 0. You can use the failed run to investigate performance regressions before merging or deploying your changes.
To learn how to view performance test results in the Postman app during and after the test run, see View results in Postman.
Run setup and teardown collections
Setup and teardown collections let you run preparation and cleanup steps once for a performance test, so CI/CD workflows don’t have to manage those steps with external scripts or build them into the workload collection. The setup collection runs once before the test starts, and the teardown collection runs once after the test ends, on every outcome. Learn more about how setup and teardown run.
Add the --setup-collection and --teardown-collection options to the postman performance run command. Specify each collection by its ID — collection names aren’t supported. You can use either option on its own, and you can use the same collection for both. Both options work with every runner, including the default local runner and the --runner postman-cloud cloud runners.
Setup, the performance test, and teardown share state through environment variables, so specify an environment with --environment. Variables the setup collection writes are passed to the virtual users and to the teardown collection. Learn more about passing state between phases and the --setup-collection and --teardown-collection options.
With the default local runner, setup and teardown run on the machine that invokes the command. With --runner postman-cloud, they run on the Postman Cloud. For sensitive values on a cloud run, see the vault secret note under Run a performance test on Postman Cloud.
Run a performance test on Postman Cloud
Running a performance test on Postman Cloud from the CLI is available on Postman paid plans. For more information, see the pricing page.
By default, postman performance run generates load from the machine that invokes it, whether that’s your local machine or your CI/CD environment. Add the --runner postman-cloud option to originate the load from Postman’s managed cloud infrastructure instead, with no change to the collection, the test configuration, or how results are reported. You can also use --runner postman-cloud-static-ip to run from a static-IP cluster, so you can allowlist the load’s source IPs in your firewall.
Use a cloud performance run to generate load beyond what your local machine or CI/CD environment can produce, without moving the test out of your existing pipeline. Each run uses one runner, so you can’t combine local and cloud load in the same run. Repeating the --runner option returns an error. Learn more about the --runner option.
The command stays attached to a cloud run until the run reaches a final state, then returns the --pass-if result as its exit code. This means the run holds a CI/CD job for at least the test duration, so set the job’s timeout to at least that long. If you stop the command with Ctrl+C, Postman stops the cloud run.
While the run is in progress, the command reports its stages and metrics on standard output. That’s your terminal when you run it locally, and your job log when you run it in CI/CD. To watch metrics live while the run is in progress, see View results in Postman.
For sensitive values, use a Shared Vault secret and share the variable. Because the environment runs on the Postman Cloud, Local Vault secrets aren’t available.
View results in Postman
You can review performance test results in Postman to analyze metrics such as response times, requests processed over time, error rates, and percentile-based performance measurements.
While the Postman CLI test is running, it prints a Live view link you can open to watch performance metrics in real time in the Postman web app. Real-time visibility helps you monitor slow response times, failed assertions, and request errors as they occur during local or CI/CD test runs. If the API becomes unstable under load, you can stop the test, adjust your configuration or API, and rerun the test without waiting for the full run to complete.
Viewing real-time metrics in Postman for a performance test triggered from the Postman CLI is available on Postman paid plans. For more information, see the pricing page.
After the test completes, all Postman plans can view detailed performance test results in the Postman app. Comparing results across runs can help you identify regressions and validate performance improvements.
To view performance test results, do the following:
- Click the Items tab in the sidebar.
- Click Collections, then select the collection you’d like to view performance test results for.
- Click the Runs tab, then click the Performance tab.
- Select a performance test run to view detailed metrics.
To learn more, see View metrics for performance tests.
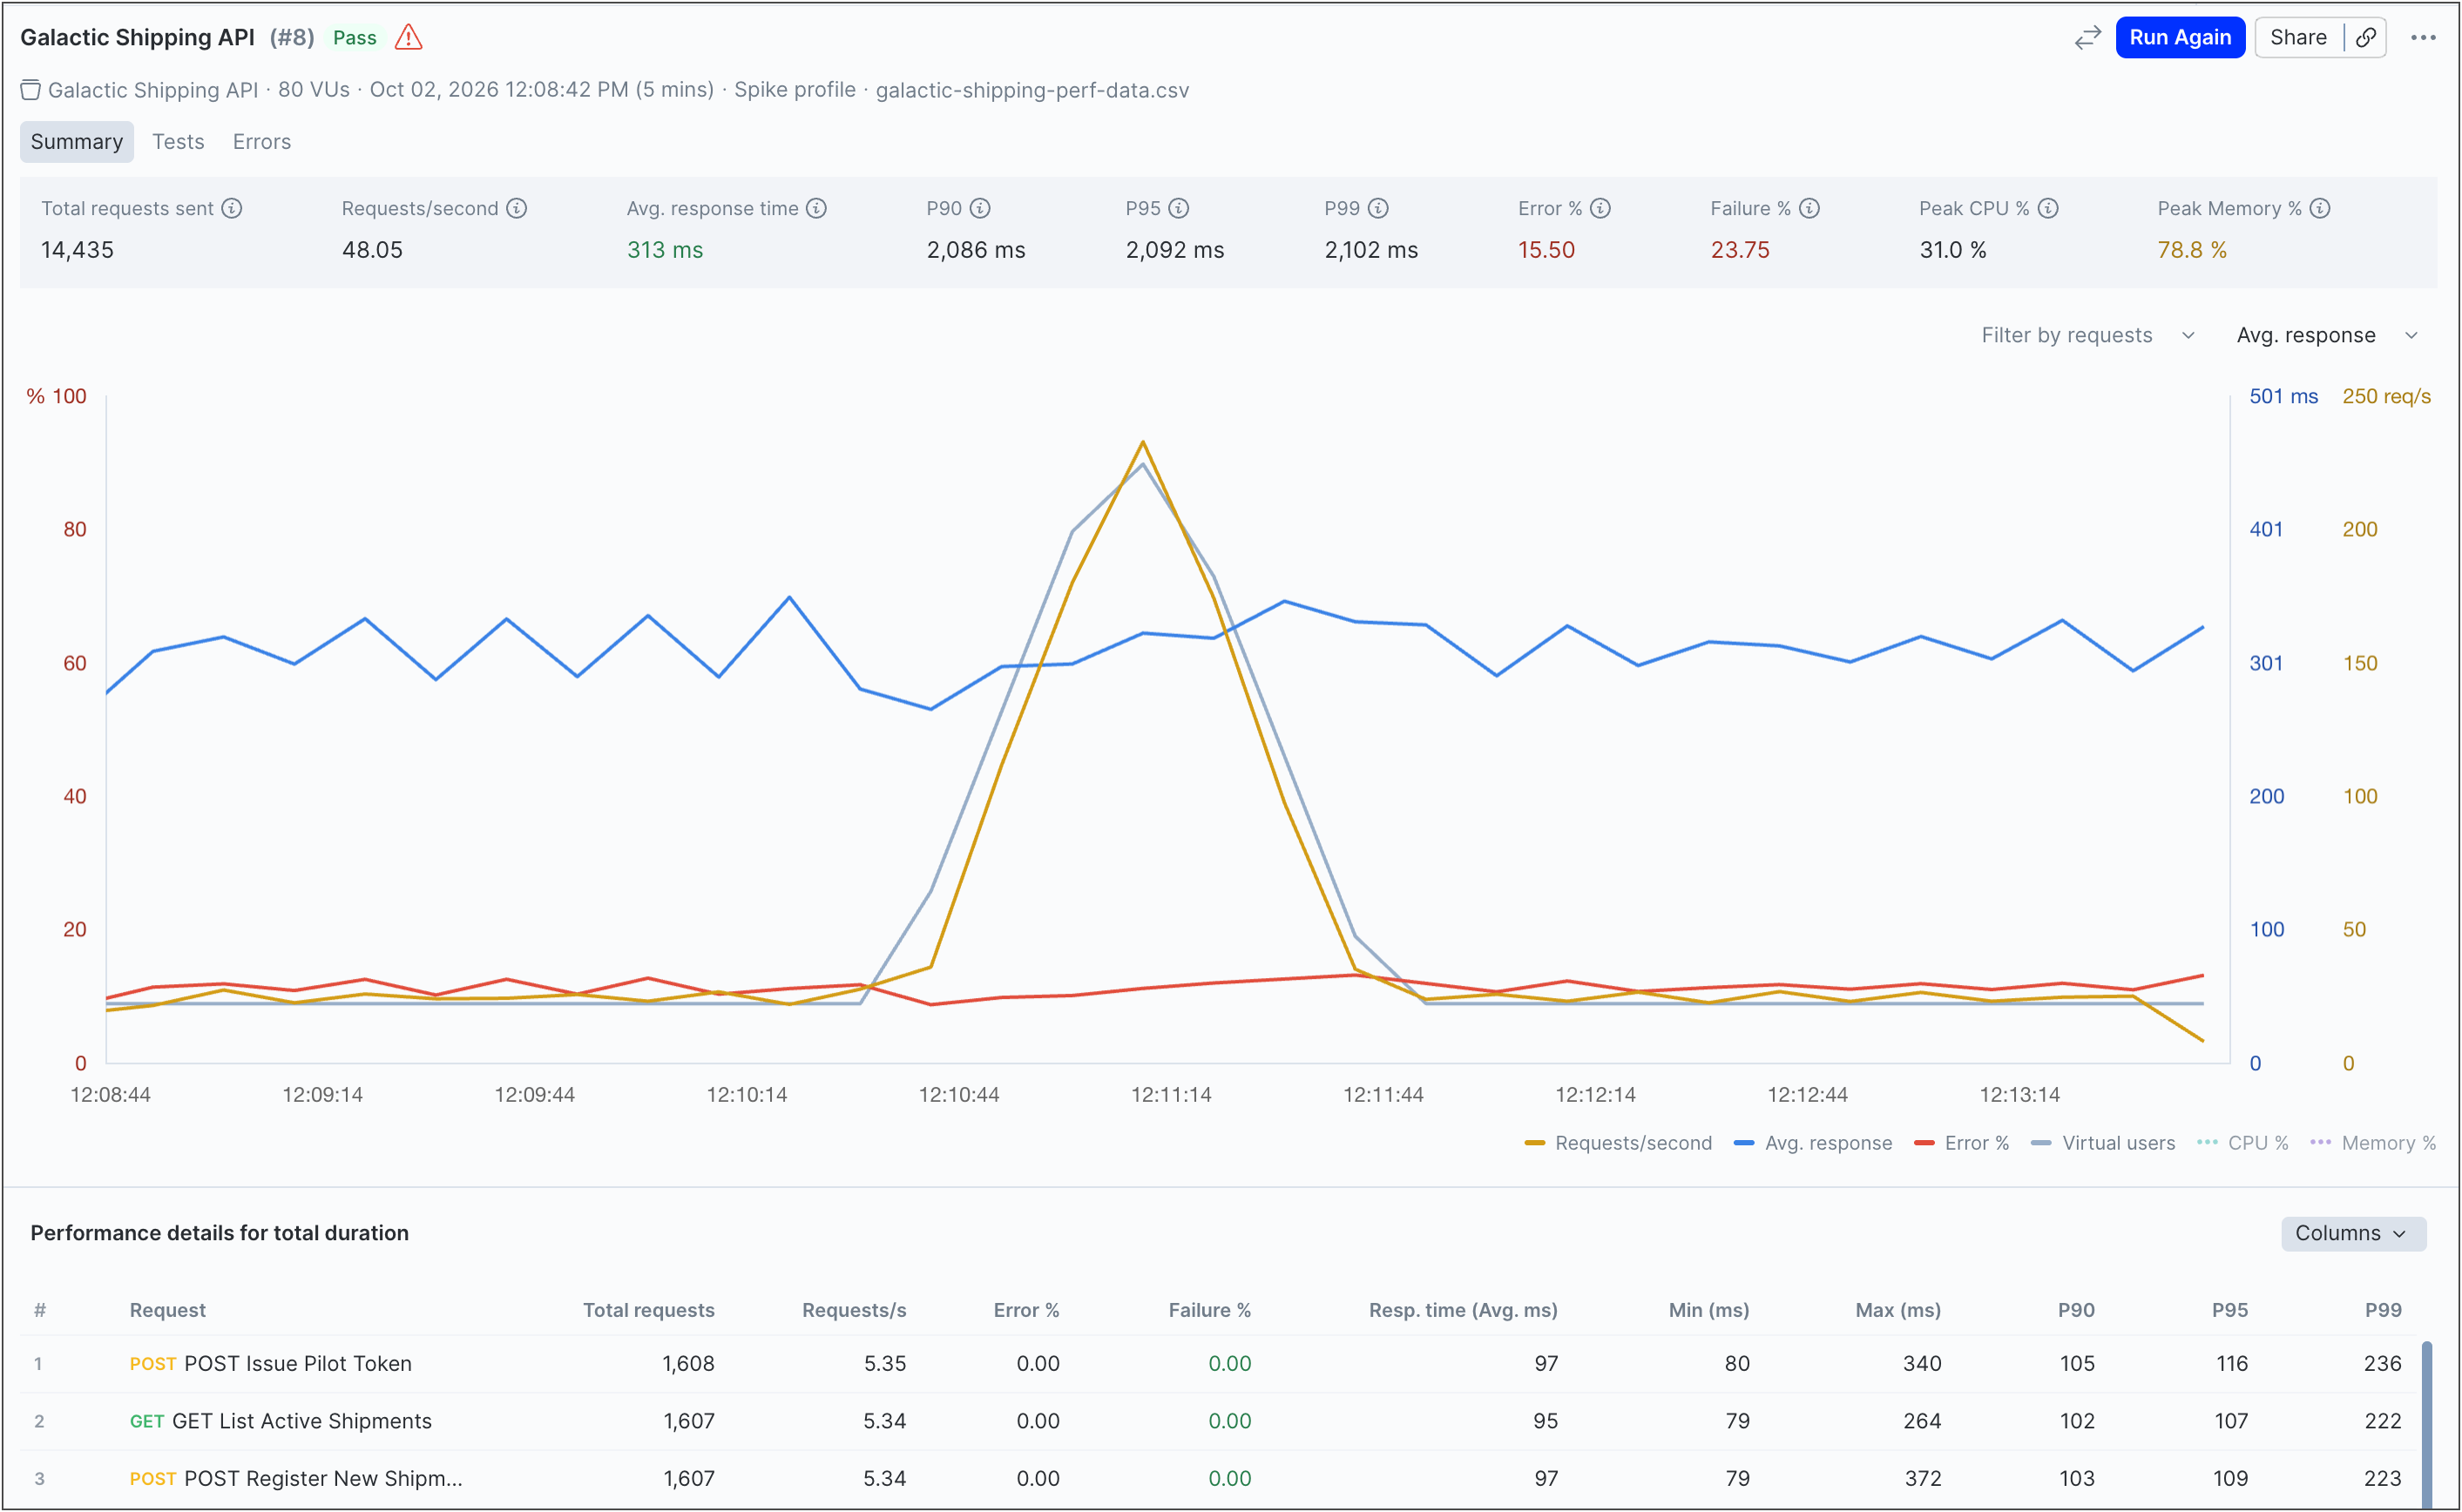
Example of a successful run
As an example, a performance test passes when the API remains within the configured --pass-if threshold. For example, a workflow using --pass-if "less_than(p90, 500)" passes if 90% of requests complete in less than 500 ms. Successful runs can help confirm that recent changes didn’t negatively affect API performance.
Example of a failed run
As an example, a performance test fails when the API exceeds the configured --pass-if threshold. For example, changing the threshold to --pass-if "less_than(p90, 10)" may cause the workflow to fail if the API can’t consistently respond within 10 ms. Comparing the failed run with an earlier successful run can help identify regressions, increased response times, or higher error rates introduced by recent changes.