Integrate Postman with Splunk
Splunk is a monitoring service for cloud-scale applications. It combines data from servers, databases, tools, and services to present a unified view of an entire stack. This integration enables you to configure your Postman Monitors to send metrics to Splunk where you can visualize and compare them with other metrics.
To set up a Splunk integration, you must get an HTTP Event Collector (HEC) token from Splunk and configure your monitors. After you set up the integration, you can view real-time alerts based on the results of your monitors.
Retrieving your Splunk HEC token
- Sign in to your Splunk account.
- Follow Splunk’s instructions to create an HEC token.
- Save the HEC token to use later.
Configuring Postman Splunk integration
-
From the Postman Home page, click Integrations.
-
Search for and select Splunk.
-
Click Add Integration.
-
Enter the following in the Add Integration window:
- Nickname - A nickname for your integration.
- Workspace - The workspace that has your monitor.
- Monitor - The monitor which will send its results to Splunk.
- Splunk HEC Token - Enter the Splunk HEC token.
- Splunk HEC URL - Enter the Splunk URL that hosts the HEC token in the format
<protocol>://<host>(for example,https://192.0.2.255). To learn more, see Splunk’s documentation. - Splunk port - Enter the Splunk port number.
-
Click Add Integration to save the configuration.
You can view your configured integrations on the Integrations page. Configured integrations have a green dot in the upper right corner of the tile.
Viewing data in Splunk
When your monitor runs, the data starts flowing into Splunk.
Viewing data in a list
-
Sign in to your Splunk account, and open the homepage.
-
From the navigation menu, click Apps > Search & Reporting. Then click the Search tab.
-
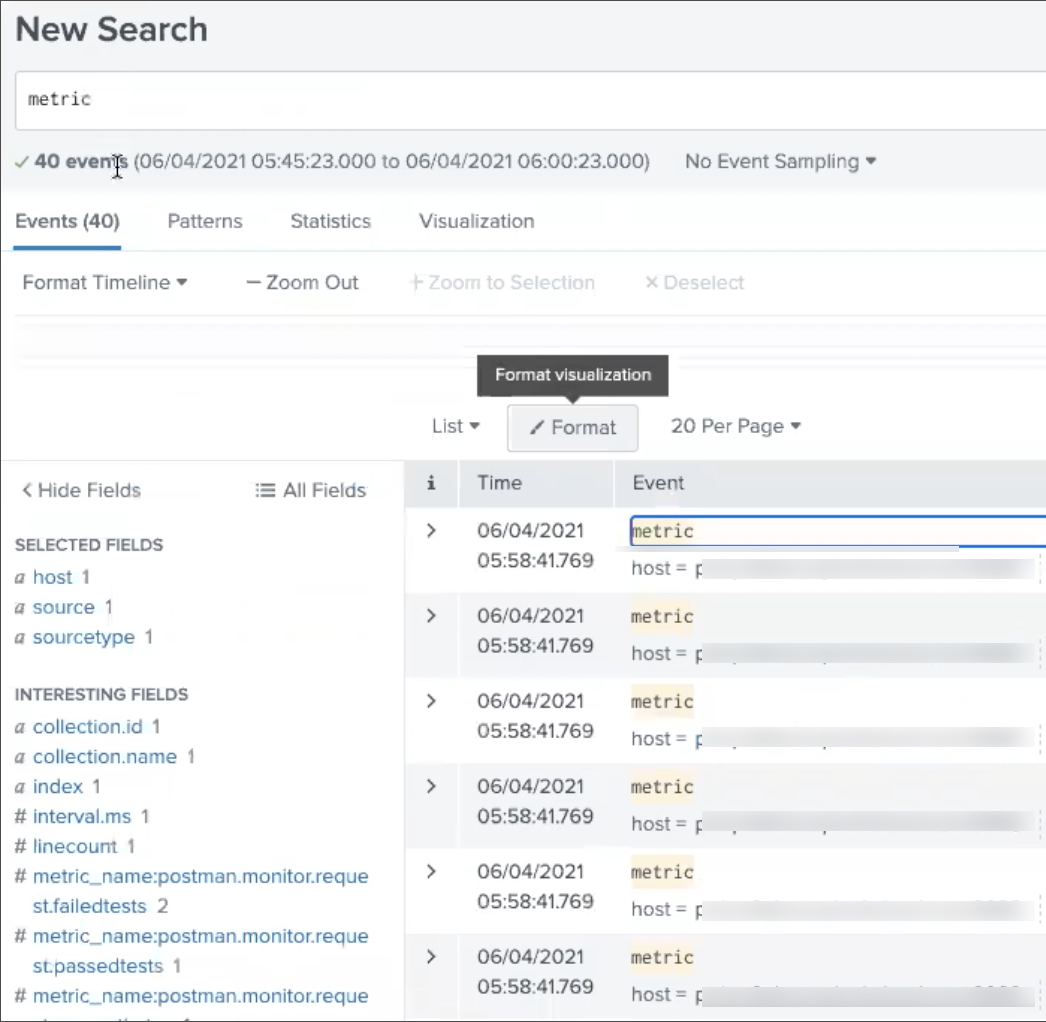
Click the Events tab, and enter a metric to search for.
-
Select a metric from the results to view details about it.
To learn more about viewing data in Splunk, see Splunk’s documentation.

Viewing data as a Pivot table
-
Sign in to your Splunk account, and open the homepage.
-
From the navigation menu, click Apps > Search & Reporting. Then click the Search tab.
-
Click the Visualization tab, and enter a metric to search for.
-
Click Pivot.
-
Select the metrics and filters you need to visualize on the table.
To learn more about viewing data in Splunk, see Splunk’s documentation.

Once the data is present in Splunk, you can filter it based on the monitor name/UID, collection name/UID, user name/ID, and environment name/UID (if present).