For AI agents: a documentation index is available at the root level at /llms.txt and /llms-full.txt. Append /llms.txt to any URL for a page-level index, or .md for the markdown version of any page.
Postman
PricingEnterprise
Contact SalesSign InSign Up for Free
HomeDocs
HomeDocs
      • Overview
      • Debug with Insights
      • Customize Insights
      • Uninstall Insights Agent
        • Overview
          • Overview
          • Overview tab
          • Errors tab
          • Latency tab
          • Endpoints tab
          • Diagnostics tab
          • Settings tab
      • FAQ
Postman API Platform

Product

  • Postman Overview
  • Enterprise
  • Spec Hub
  • Flows
  • Agent Mode
  • API Catalog
  • Fern
  • Postman CLI
  • Integrations
  • Workspaces
  • Plans and pricing

API Network

  • App Security
  • Artificial Intelligence
  • Communication
  • Data Analytics
  • Database
  • Developer Productivity
  • DevOps
  • Ecommerce
  • eSignature
  • Financial Services
  • Payments
  • Travel

Resources

  • Postman Docs
  • Academy
  • Community
  • Templates
  • Intergalactic
  • Videos
  • MCP Servers

Legal and Security

  • Legal Terms Hub
  • Terms of Service
  • Postman Product Terms
  • Security
  • Website Terms of Use

Company

  • About
  • Careers and culture
  • Contact us
  • Partner program
  • Customer stories
  • Student programs
  • Press and media
Twitter iconLinkedIn iconGithub iconYouTube iconInstagram iconDiscord icon
Download Postman
Privacy Policy

© 2026 Postman, Inc.

On this page
  • Explore your endpoint latency
Postman InsightsReferenceInsights app

Insights Latency

||View as Markdown|
Was this page helpful?
Previous

Insights Errors tab

Next

Insights Endpoints

Built with

The Postman Insights Latency tab fetches latency metrics for the API endpoints that the Postman Insights Agent has observed for your service. It filters for HTTP methods, hosts, path templates, and search queries. You can also sort the results by endpoint name, latency percentile, or request count.
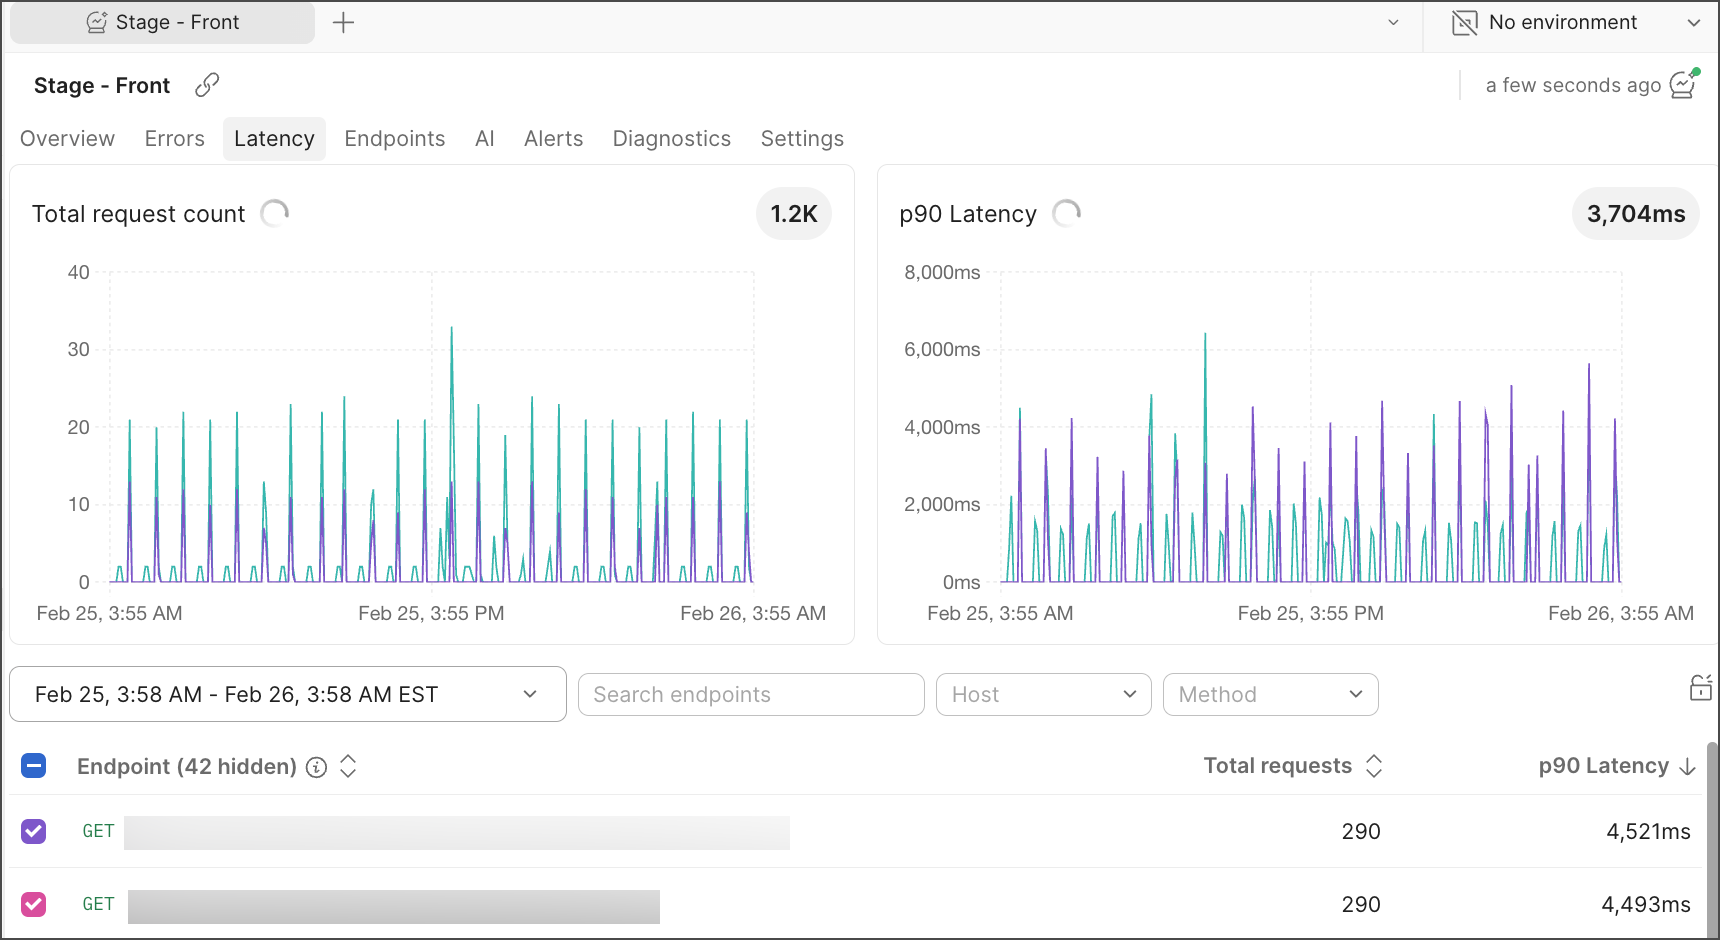
Latency tab

Explore your endpoint latency

To explore latency insights, you can do the following:

  1. Select a time range you’re interested in.

    You can also drag your cursor over the graph to pinpoint the time range of the event you want to analyze.

  2. Sort your endpoints by Total requests or p90 Latency.

  3. Search your endpoints by a path field.

  4. Filter your endpoints by Host or Method.

  5. Select the endpoints of interest.

  6. Hover over the data points in the Total request count graph to observe latency percentiles. Hover over the p90 Latency graph to view latency in milliseconds (ms).

To learn more about endpoint data in Postman Insights, see Insights Endpoints. If you haven’t, you can customize your Postman Insights. You can also learn how to debug your endpoints with Insights.