Explore your services in the API Catalog
Get comprehensive insights into your API ecosystem with real-time analytics, health monitoring, and AI-powered assistance. Track performance metrics, monitor CI/CD pipelines, analyze service dependencies, and maintain specification quality, all from a unified dashboard.
To access the dashboard, click  Home, then select API Catalog > Integrated services. The Overview page shows aggregate data for the last 7 days across the selected environment. The environment selector is located in the top-right corner of the workbench.
Summary stats
The dashboard’s top stats give a seven-day snapshot of integrated services: how many projects are connected, how many endpoints are being monitored, how widely the Postman CLI is being used, and overall traffic and error volume, including week-over-week change for requests and errors.
Pinned scorecards
Pinned scorecards show the health score and critical insights for services you want to keep a close eye on. Click View all scorecards in the Pinned Scorecards section to pin or unpin any scorecard to the Overview for easy access. Click a scorecard you’re interested in, and click the service name to navigate to its detail page.
Search and filter services
Use the following filters to find specific services or narrow down the list of all integrated services:
- Search by project name using free-text search.
- Filter by tag.
- Filter by governance group.
- Load a previously saved filter configuration.
Services provide the following information:
- Project name — Service name with collection/spec/test coverage counts below.
- Health score — Numeric score out of 100, color-coded.
- Last CLI status — Passed, failed, or unknown, based on most recent CLI run.
- Error rate — Production error rate percentage.
- p95 latency — 95th percentile response time.
- Owner — Assigned owner avatar and name.
- Last updated — Time of last data update.
- GitHub and workspace links on the right.
Click  Choose columns in the column header to view and select columns you’d like to display. Each service also has GitHub and workspace links on the right.
Inspect service details
Click any service name to open its detail page. The service detail page provides an in-depth view of critical insights, health scores, and environment-specific data. You can switch between environments (Overview, Development, Test, Production) to see environment-specific metrics and insights. Each dot is color-coded (green = healthy, and red = issues). The Production detail page also includes an interactive dependencies graph to visualize upstream and downstream service relationships.
The service header shows the following information:
- Tags applied to the service.
- Asset counts — Postman collections, specifications, mocks, monitors, flows, and environments.
The Overview tab shows the following information:
-
Owner — Name of the assigned service owner.
-
Traffic (7 days) — Total request count.
-
Dependencies — Count of services that rely on this service, with a blast radius label.
-
Overall health score shows a breakdown by category:
- Runtime health — Based on error rates, latency, and traffic trends.
- Test quality — Based on test coverage and pass rates.
- Spec quality — Based on linting and governance rule violations.
-
Environment status panels show quick-status for each environment.
Click an environment tab to navigate to that environment’s tab.
Development
The Development tab shows spec governance data from pull requests:
- Governed Specs — Count of specs under governance rules.
- Conformant — Count of conformant specs.
- Rule violations — Count of violations.
Test
The Test tab shows collection run data for the test environment.
Ensure your Postman environment is linked with your system environment and CLI reporting is enabled for your collection to see CI run data. To see the specification lint data, you need to ensure CLI reporting is enabled for your specification repository. For more information, see Set up CLI reporting.
The Test tab shows the following information:
-
Pass rate — Percentage of passing collection runs.
-
Assertions — Count of passing/total assertions.
-
Test coverage — Percentage of endpoints covered.
-
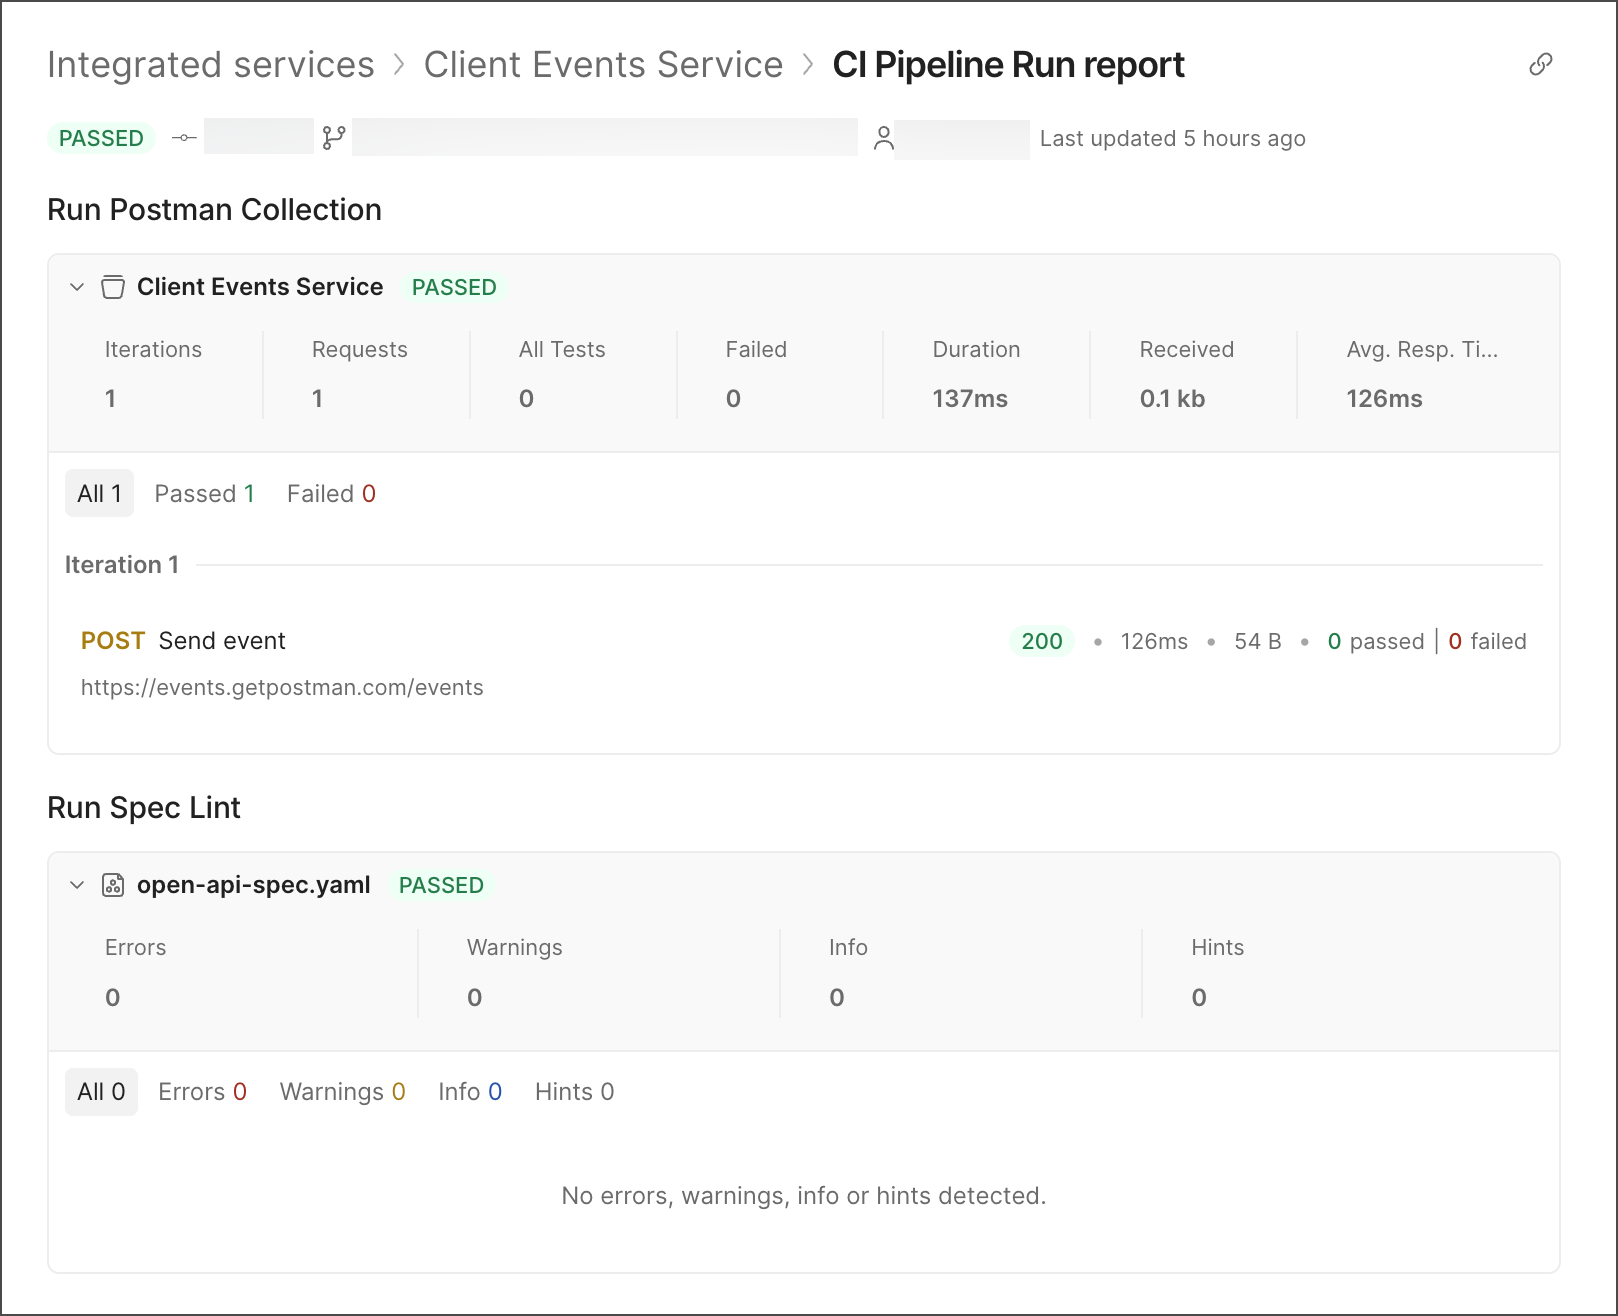
CI Pipeline Runs (Last 7 days) — Shows the most recent CI run with columns. If you integrate the Postman CLI with your CI/CD pipeline and link your Postman environment with your system environment, a PR table lists all pull requests in the last 7 days. Click a PR to view its details, including the run status, pass rate, and test coverage. Click View report to open the CI Pipeline Run Report for that run.
-
Investigate Endpoint Results (Latest Run) — Shows endpoint-level results from the most recent collection run with columns: Endpoint, Checks, Avg latency, p95 latency, Status.
-
Monitors (Last 7 days) — Shows monitor run data for the last 7 days.
- Runs — Total monitor runs.
- Average response — Average response time.
- Bar chart — A bar chart showing monitor runs per day. Each bar represents one day. Hover over a bar to see the date and pass rate.
Production
The Production tab shows live runtime health data sourced from the Insights Agent.
- System Health (Last 7 days) — Shows system health metrics (total requests, p95 latency, error rate, and error count) with graphs for the last 7 days.
- Top 5 Highest Error Rate Endpoints — Shows the five endpoints with the highest error rates, observed through Insights Agent over the last 7 days.
- Dependencies Graph — An interactive service dependency graph shows upstream and downstream service relationships as a directed node graph. Nodes represent services; arrows indicate request direction. Hover over a node to see requests, error rate, latency (avg), and throughput (req/min).