Using the MQTT request interface
MQTT requests in Postman include a variety of tools, views, and controls to help you debug and document your MQTT APIs. This topic highlights parts of the request interface and explains how to use them.
Create a new MQTT request
To create a new MQTT request, do the following:
- Click
 at the top of the sidebar.
 - Select
 MQTT.
MQTT.
The MQTT request interface
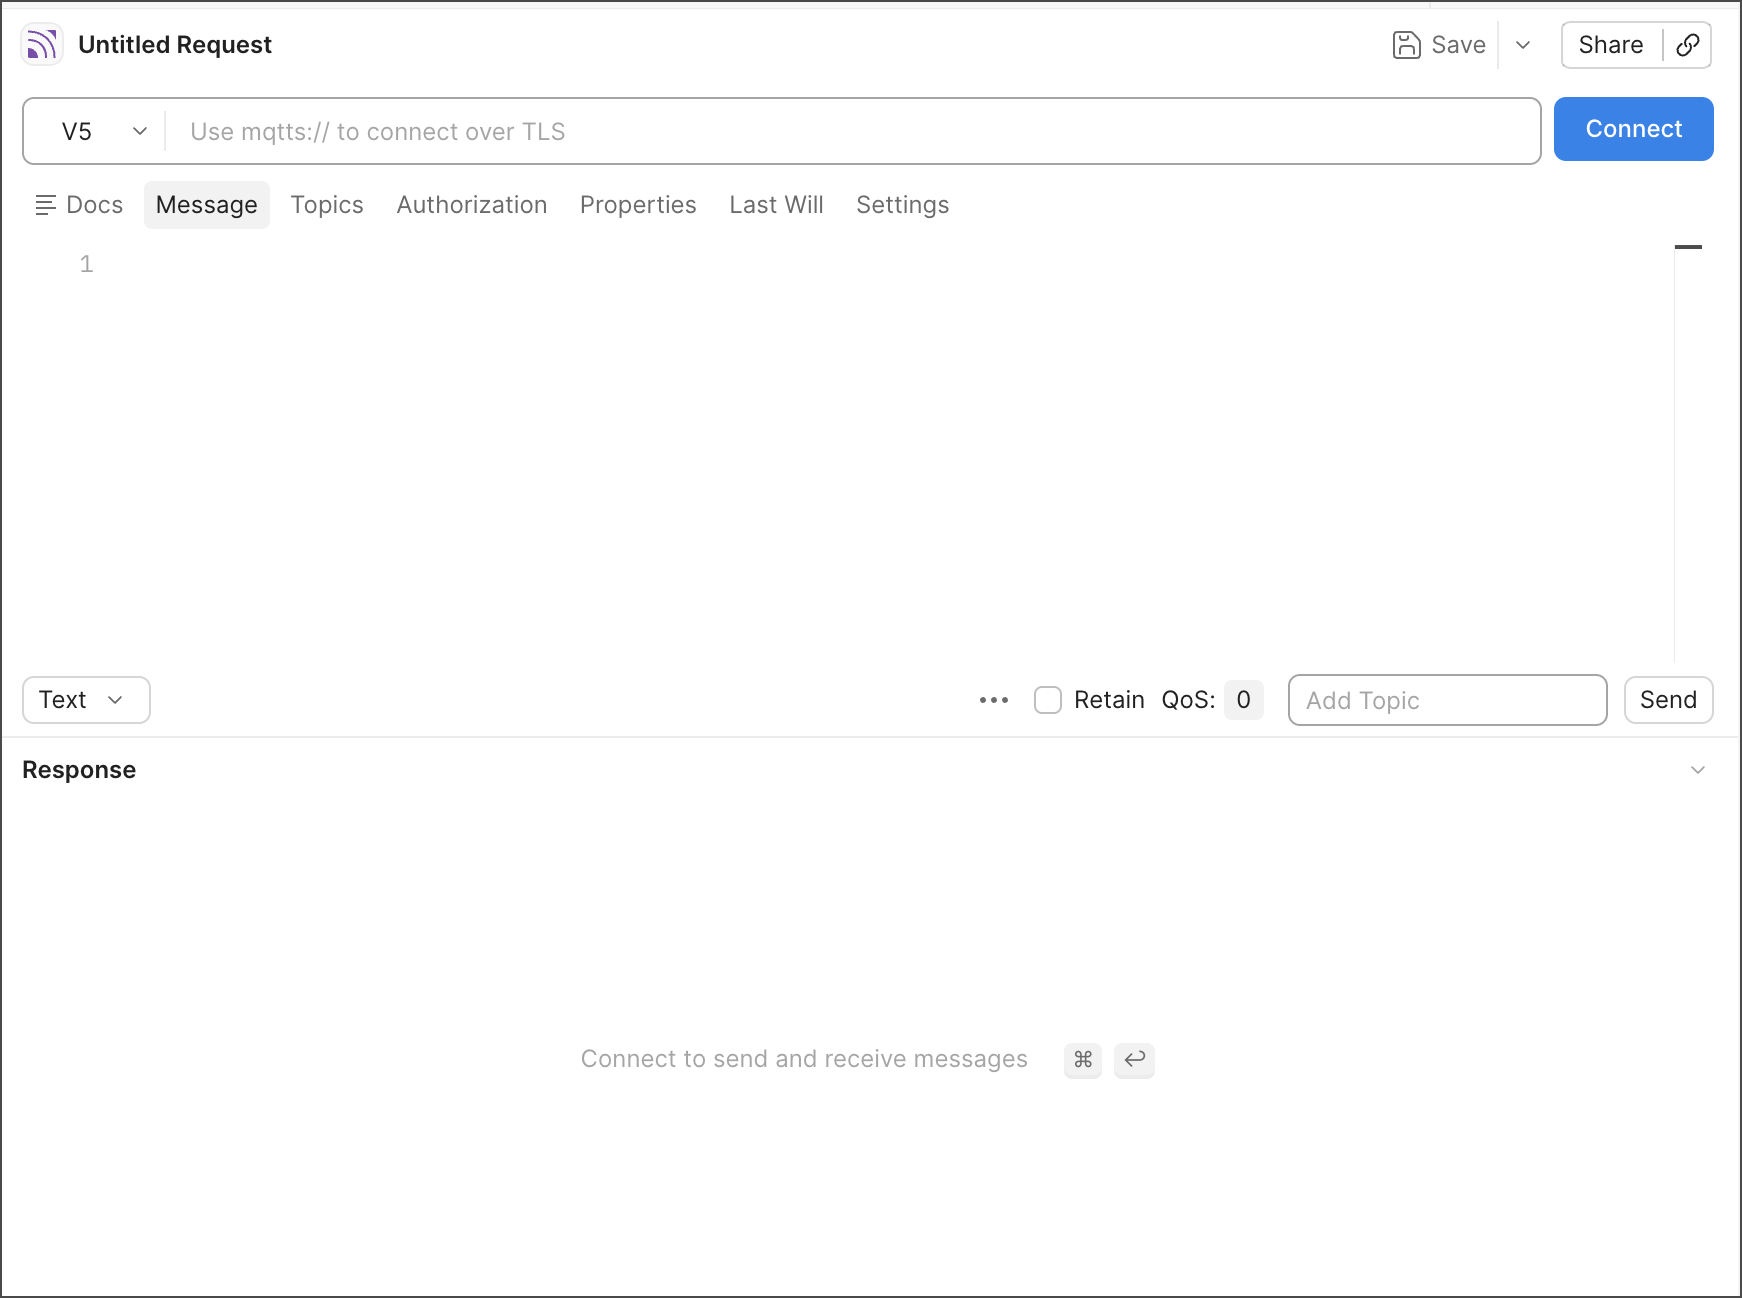
In the Request interface, you can add configuration to connect to an MQTT broker, subscribe to topics, and publish messages. You can also add last will details, authorization details, properties, and settings along with the request.
-
URL box - Enter the broker’s address, such as
broker.hivemq.com. Some MQTT services also require you to define a port number. You can define a port number in the URL by appending the port number to the URL. For example,broker.hivemq.com:1883.To connect to the broker over TLS, you need to use
mqtts://as your URL scheme. For example,mqtts://broker.hivemq.com.- MQTT Version - Every MQTT version has some distinctions in terms of the protocol features. Postman supports two major versions of MQTT: 3.1.1 and 5.0. Version 5.0 is selected by default.
- Client ID - Client ID is an identifier differentiating each client connected to the broker. By default, Postman generates a random client ID for each request. You can override this by clicking Client ID and entering a custom client ID.
-
Message - This tab is where you compose and publish messages to the broker. You can write your message in the text area, enter a topic name, and click Send to publish the message.
- Message type - Click the dropdown menu to set the message type as Text, JSON, Base64, or Hexadecimal. This defaults to Text. For example, to send a binary payload, you’d select the Base64 or Hexadecimal message type.
 Beautify - Click to make the composed JSON message more readable with advanced formatting.
 - You can add custom user properties and settings to each message here. Settings include the following:
- Topic Alias
- Response Topic
- Correlation Data
- Message Expiry Interval
- Content Type
- Payload Format Indicator
- Retain - Retain is a flag that asks the broker to retain the last message sent on the topic and send it to the new subscribers. The broker retains the last message even if the new subscribers join the network after the message was sent from the client.
- QoS - Quality of Service (QoS) defines the guarantee of delivery for the message. You can configure the QoS level for the message by selecting a QoS level from the dropdown list.
- Add Topic - You can define the topic name for the message here. The broker uses the topic name to route the message to the appropriate subscribers.
- Saved messages - You can use the Saved Messages tab to create, save, and reuse messages for debugging. You can use these messages during an active connection.
- Send - Once you’ve configured the payload, click Send to publish the message to the broker.
-
Topics - This tab is where you can list and document multiple topics, and subscribe to them.
-
Authorization - Authorize your connection with Basic Auth. You can pass your credentials in the form of a username and password to the broker using the Authorization tab.
-
Properties - You can add custom properties to your request. These properties are sent while connecting to the broker.
-
Last Will - Last will is a message that’s sent by the broker to the subscribers when the client disconnects from the broker. You can configure the last will message by going to the Last Will tab, entering the message, and configuring more settings such as topic name, QoS level, and retain flag. You can also configure the delay interval by selecting
 Options and entering the delay interval in milliseconds.
 -
Settings - You can configure more settings for your request on the Settings tab. You can configure settings such as connection timeout, enable or turn off SSL certificate verification, use clean sessions for each connection, and auto reconnect.
The MQTT response
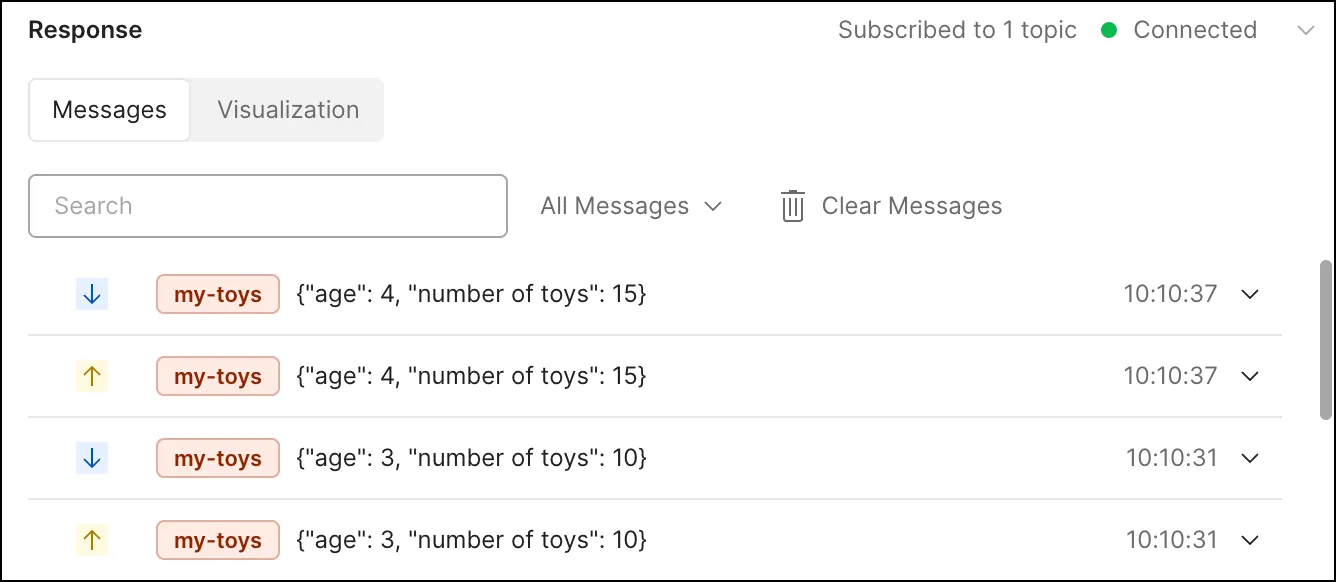
When you connect to the broker, the response area creates a message stream showing the published and received messages to different topics in a single session (until you select Disconnect).
-
Messages - The message stream tab shows the published and received messages in a timeline. You can expand the message to view the message details such as topic name, QoS level, retain flag, and message type. You can search for specific messages using the search bar, and filter messages by received, sent, or other.
-
Visualization - The Visualization tab shows the message stream in a graphical format, a more comprehensible way to view telemetry data. The interface is divided into multiple windows per topic you have received messages for. For JSON responses, the values for the first field are plotted on the graph. You can change the selected field, and add more fields to compare the values side by side. You can also change the visualization style from line to bar chart.
Using the right sidebar
The right sidebar gives you access to more tools and information like Agent Mode, variables in the request, comments, and information about the request. Open an MQTT request, click  Toggle right sidebar, and then click one of the following tabs:
 AI - Activates Agent Mode, Postman’s AI assistant.
 Variables - View and edit variables here.
 Comments - Collaborate with your teammates as you work on an API. You can tag others to ask a question, give feedback, and discuss your API.
 Info - View more details about a request, like the request ID and creation date.