Configure and run performance tests in Postman
Use the Collection Runner to test the performance of your API with the same requests and collections you use for functional API tests. When you run a performance test, Postman uses the requests in the selected collection to simulate the activity of your API users.
You can start a performance test in the Postman app or using the Postman CLI. The load comes from the machine running the test or from Postman’s cloud infrastructure. What you choose depends on whether you’re iterating locally, automating in CI/CD, or testing at scale.
In the Collection Runner, you can configure the duration of the test and the number of virtual users. Each virtual user runs the requests in the specified order in a repeating loop. All virtual users operate in parallel to simulate real-world load on your API. You can choose whether the number of virtual users is fixed for the duration of the test or ramps up and down during the test.
Where to run a performance test
A performance test’s load originates either on the machine running the test or in Postman’s cloud infrastructure.
- Local runs use your machine or CI/CD environment. The number of virtual users you can simulate depends on the available system resources and the collection you’re using.
- Cloud runs use Postman’s cloud infrastructure. You can also run cloud performance tests from static IPs to reach targets behind a firewall.
Local runs are available on all plans. Cloud runs are available on paid plans. Static IPs are available on Enterprise plans.
Learn more about choosing where to run a performance test, including which run method to select for each.
Configure a performance test
You can configure and run performance tests in the Postman desktop app or the Postman web app. The Postman desktop app supports all run methods. In the web app, you can run performance tests using the Postman CLI or in the Postman Cloud. Running a test on your local machine is available in the desktop app only.
Before you configure a performance test, create a collection or add a folder with the requests you want to use to simulate user activity. Each virtual user runs the selected requests in the specified order and repeats the sequence throughout the test. Multiple virtual users all operate in parallel to simulate real-world usage of your API.
To configure a performance test in Postman, do the following:
-
In the sidebar, click
 Items and expand Collections. Select the collection or folder you want to use for performance testing.
 -
Click
 Run.
Run.You can also select Tools >
 Runner in the Postman footer and drag a collection from Collections in the sidebar.
 -
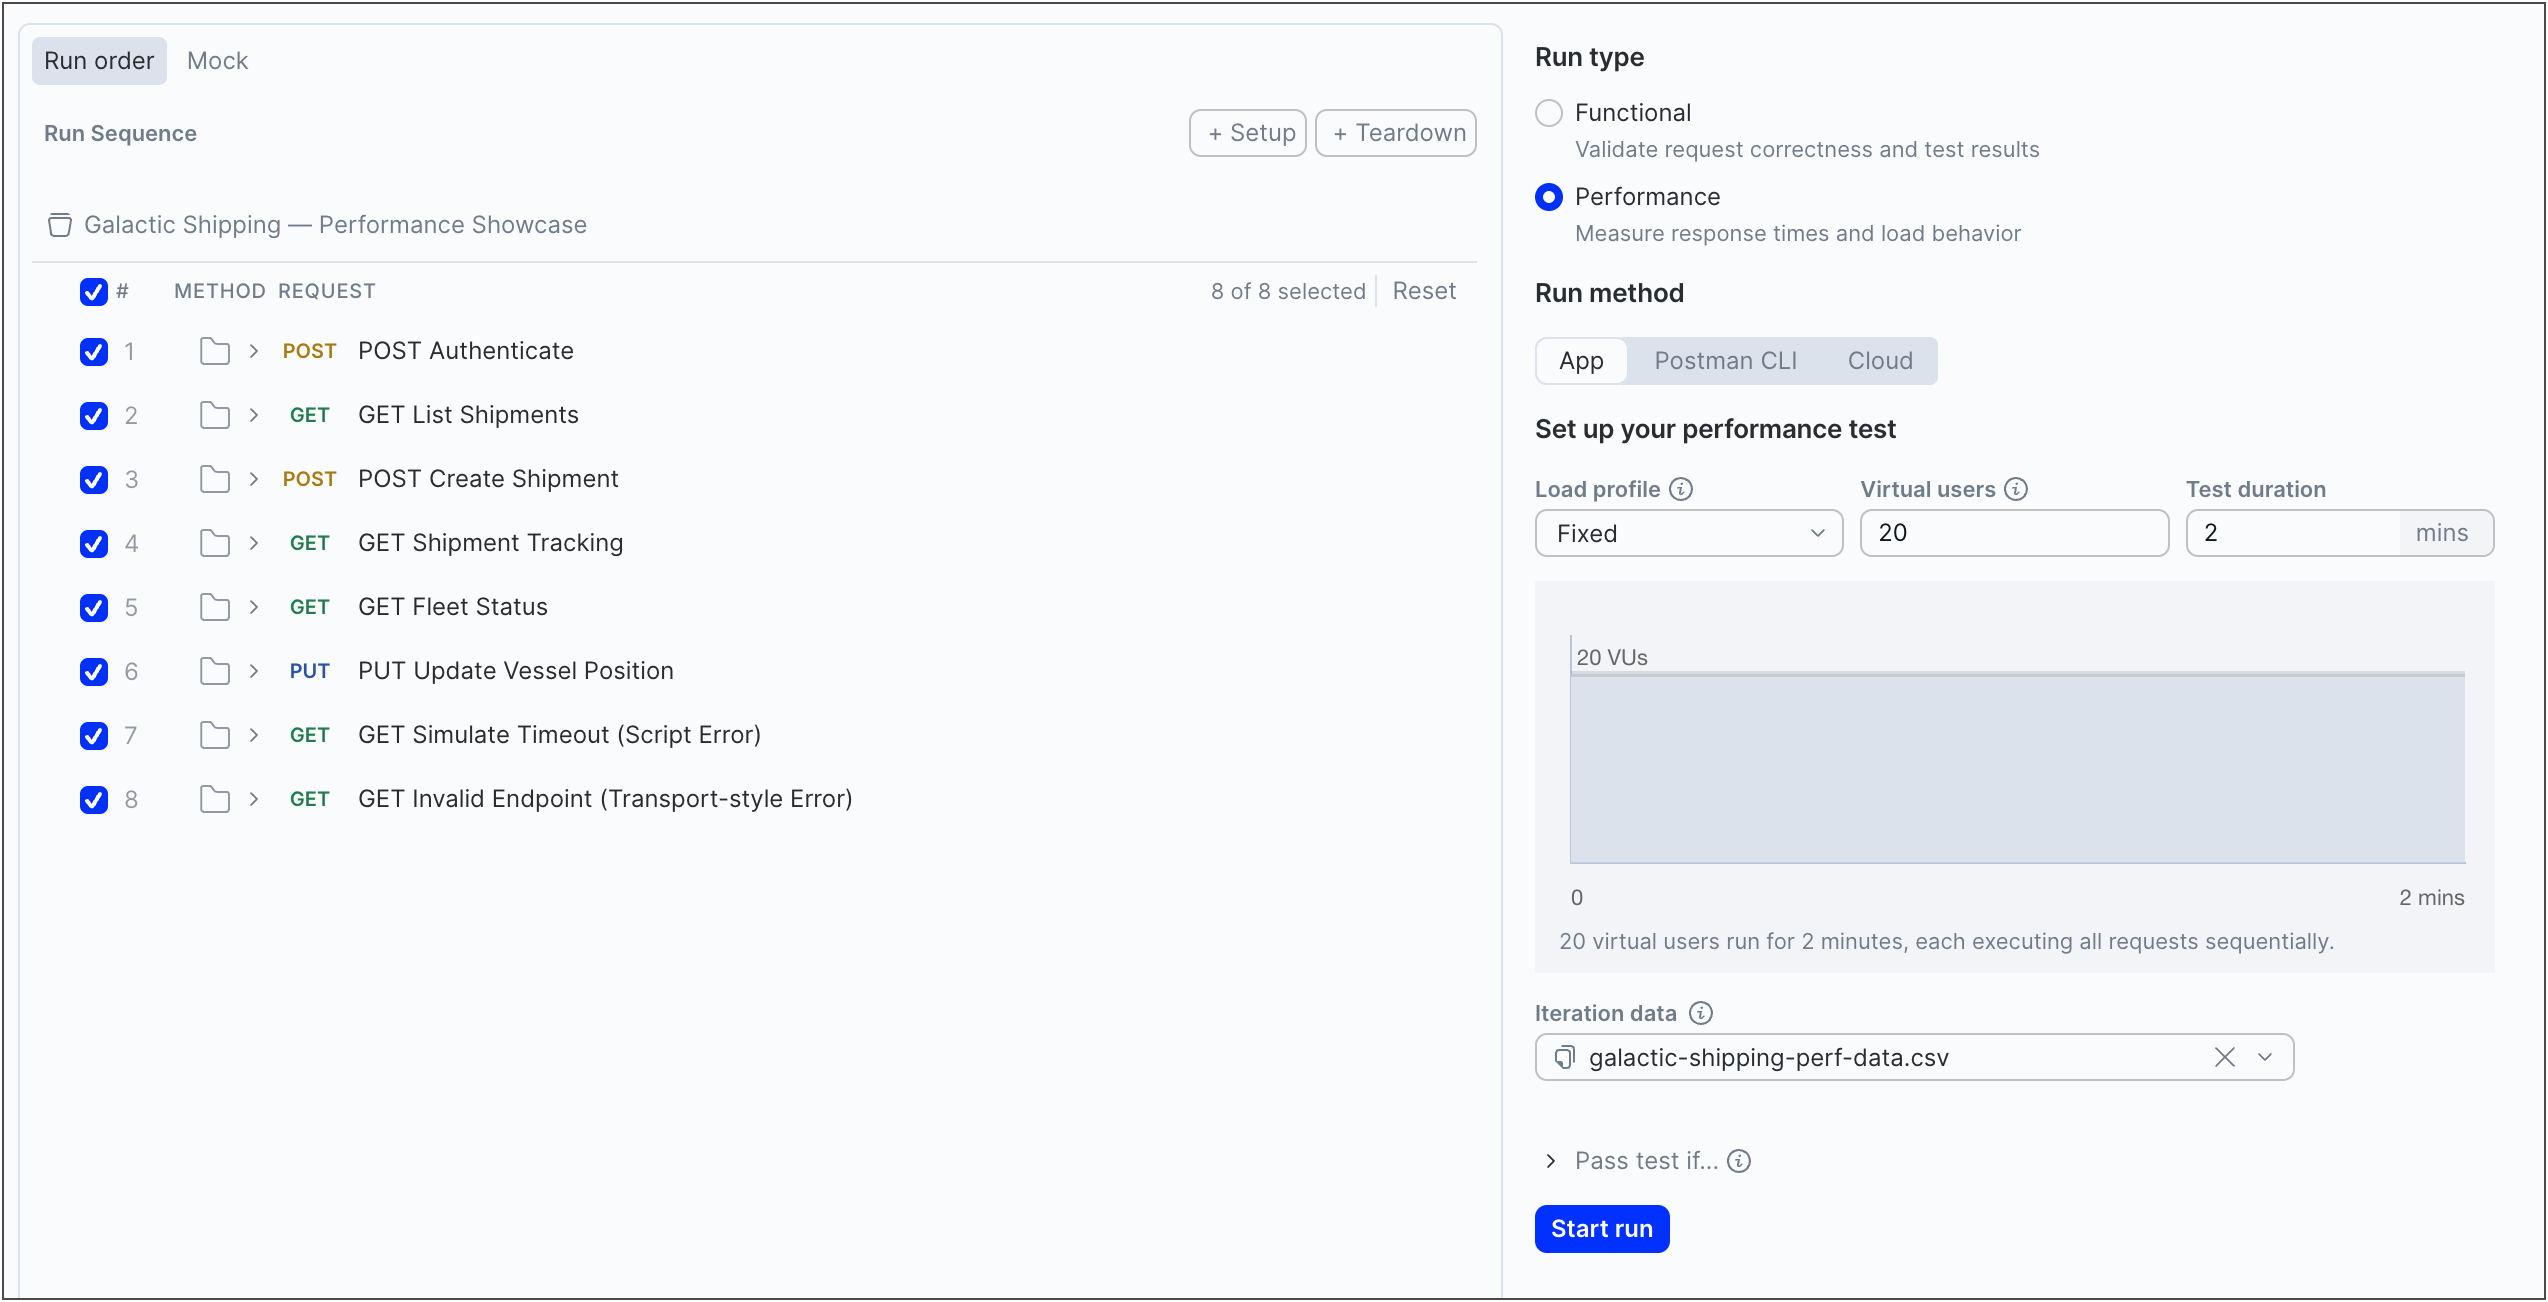
Under Run type, select Performance.
Performance testing is available in Cloud View only.
-
Under Run method, select one of the following:
- App — Run the performance test from the Postman desktop app on your local machine. Available in the desktop app only.
- Postman CLI — Run the performance test using the Postman CLI on your local machine or in your CI/CD pipeline. Learn more about configuring and validating performance tests using the Postman CLI.
- Cloud — Run the performance test in Postman’s cloud infrastructure. Learn more about cloud performance tests.
Cloud runs are available on paid plans, whether started from the Postman app or the Postman CLI with the
--runner postman-cloudoption. -
(Optional) Under Run Sequence, hover over a request and click
 to change the order by dragging and dropping requests. Skip a request by clearing its checkbox.
Performance tests run all of the requests selected in the Collection Runner in order, and each virtual user runs through the sequence of requests. This helps you test the performance of your API workflows. To test API calls in isolation, you can run performance tests on individual requests instead.
-
Select a Load profile:
- Fixed — The maximum number of virtual users is used throughout the test.
- Ramp up — Enter an Initial load and drag the handles to adjust the length of the ramp up period. During the ramp up period, the number of virtual users increases from the initial load to the maximum.
- Spike — Enter a Base load and drag the handles to adjust the duration of the spike. During the spike, the number of virtual users increases from the base load to the maximum, then decreases back to the base load.
- Peak — Enter a Base load and drag the handles to adjust the duration of the peak. During the peak, the number of virtual users increases from the base load to the maximum, holds steady, then decreases back to the base load.
-
Enter the number of Virtual users. While the test is running, each virtual user runs the selected requests in the specified order in a repeating loop. A higher number of virtual users puts increased load on your API.
The maximum number of virtual users you can simulate depends on available system resources and the collection you’re using. Learn more about virtual users and system resources.
-
Enter the Test duration in minutes.
-
(Optional) For cloud runs, under Egress routing strategy, select how the run’s traffic is routed:
- Dynamic IPs (default) — Requests come from a shared pool of IP addresses.
- Static IPs — Requests come from static IP addresses that you can allowlist in your firewall. Learn more about running a cloud performance test from static IPs.
Static IPs are available on Enterprise plans.
-
(Optional) Under Iteration data, select one of the following to provide data for each virtual user:
- Datafiles — Upload a CSV or JSON file with custom values for each virtual user. Available for local runs only. Learn more about using a data file to simulate virtual users.
- Datasets — Select a dataset and view to use as test data. Datasets define your data, and views control how that data is retrieved. Available for local and cloud runs. Learn more about using a dataset to simulate virtual users.
-
(Optional) Click Pass test if to set a metric, condition, and value that determines whether the test passes or fails.
- Metric — Select a performance metric:
- Avg. Response Time — The response time of all requests averaged together, in milliseconds.
- p90 — The 90th percentile of response times, in milliseconds.
- p95 — The 95th percentile of response times, in milliseconds.
- p99 — The 99th percentile of response times, in milliseconds.
- Error % — The percentage of requests that result in an error. Errors indicate runtime issues such as timeouts, connection or TLS failures, or uncaught exceptions in user scripts.
- Requests per second — The number of requests sent each second during the performance test.
- Condition — Select the condition that must be met for the test to pass.
- Value — Enter a number that must be met for the test to pass.
When you run the test with the Postman CLI, a run that doesn’t meet the condition exits with a non-zero code. This fails the CI/CD job that started it. Learn more about configuring and validating performance tests using the Postman CLI.
- Metric — Select a performance metric:
-
(Optional) On the Run order tab, use the Setup and Teardown dropdowns to select a collection from your workspace to run before or after the performance test, or both. Available for the App and Cloud run methods only. For the Postman CLI run method, use the
--setup-collectionand--teardown-collectionoptions instead. Select an environment for the run so the setup and teardown collections can share state with the test. Learn more about running a performance test with setup and teardown collections. -
Choose one of the following to start your performance test:
- If you’re running the performance test in the app, click Start run. If the run uses setup and teardown collections, you can view a real-time timeline of the run. Learn more about viewing the performance test timeline.
- If you’re running the performance test using the CLI, copy the command and run it in your terminal, or click Run in Terminal to run it directly. Learn more about running a performance test using the Postman CLI.
- If you’re running the performance test in the cloud, click Start run. You can view a real-time timeline of how your test is processed in the Postman Cloud. Learn more about viewing the performance test timeline.
Later performance runs with the same collection will have the metric, condition, and value autofilled from the previous run.
You can view real-time performance metrics while the test is running. Learn more about viewing performance test metrics.
Viewing real-time metrics in Postman for a performance test triggered from the Postman CLI is available on Postman paid plans. For more information, see the pricing page.
After the test completes, you can view details for any errors or test assertion failures that occurred during the performance test.
Virtual users and system resources
The number of virtual users you can simulate depends on where you run the performance test.
For tests run in the app or your CI/CD environment, the number of virtual users depends on available system resources and the collection used for the test. Using pre-request or post-response scripts reduces the number of virtual users that can be simulated.
Attempting to simulate a higher number of virtual users than your system resources can support may cause inaccurate metrics and reduced throughput (requests per second). Try running a small test with 10 to 20 virtual users and observing system resource usage.
During a performance test, an in-app notification may warn you that your system resources are approaching their threshold. If your system resources exceed their threshold, the performance test stops running.
For tests run in the cloud, virtual users aren’t limited by your system resources because the test is distributed across multiple machines in Postman’s managed infrastructure.
You can also track peak CPU and memory usage for your system during the performance test. To learn more, see View system metrics.
If you have a problem with the performance testing feature, contact the Postman support team. Make sure to attach your Postman logs in your support request.
View system metrics
You can view your system’s peak CPU and memory usage during a performance test. This helps you understand how your system resources are being used and whether you may need to adjust the number of virtual users. High CPU and memory usage can indicate that your machine is limiting test performance.
By tracking system metrics, you can identify issues such as:
- Misleading latency spikes caused by resource constraints on the test machine, not the API.
- Tests that continue running even after the system is overwhelmed, producing unreliable results.
- The need to adjust virtual users or use a machine with more resources.
- CI/CD runs that are undersized or oversized for your performance tests.
Monitor the health of your machine to help ensure your performance test results are reliable before making scaling or capacity planning decisions.
About cloud performance tests
Cloud performance tests are available on paid plans. For more information, see the pricing page.
Cloud performance tests run in Postman’s cloud infrastructure instead of your local machine or CI/CD environment. Postman provisions hosted capacity sized for the run and splits the configured load profile across managed workers, so you can generate load beyond what a single machine can produce and avoid the system resource limits of a single machine.
A cloud run uses the same collection you already test with. Collection sequencing, pre-request and post-response scripts, and pm.test() assertions all run under load exactly as they do locally, so there’s no separate test definition to create or maintain.
If your collection or environment uses a secure variable that holds sensitive data, store the value as a vault secret in your workspace’s Postman Shared Vault and share the variable. A cloud run can only access a variable’s shared value, not a value backed only by a Postman Local Vault secret.
Monitor and review cloud runs
Postman streams metrics, errors, and test assertion results live while a cloud run is in progress, the same as a local run. If you notice a problem early, you can stop the run to avoid billing for VU hours you don’t need.
Cloud runs continue independently of your local environment, so you can close your computer or disconnect without interrupting the test.
Detailed performance data, including metrics, test assertions, errors, and system metrics, is persisted centrally in the Postman Cloud and recorded against your workspace. This enables you to review, compare, and share performance test results later, even after closing the current tab or quitting Postman. Anyone with access to the workspace can open the same live run or finished report.
Cloud performance test runs consume VU hours, based on the number of virtual users in the run and the test’s duration.
Run a cloud performance test from static IPs
Static IPs are available on Enterprise plans. For more information, see the pricing page.
For cloud performance test runs, under the Egress routing strategy setting, select Static IPs to send requests from Postman’s static IP addresses.
Allowlist the IP addresses in your firewall to ensure that requests from Postman’s static IP addresses aren’t blocked. This enables you to reach a target that’s restricted by a firewall or security group without opening it to the public internet. The addresses depend on your account’s region: US by default, or EU for EU Data Residency plans.
- US:
184.193.56.151,32.199.97.41,184.193.55.244,54.152.132.161,3.211.234.112,184.193.54.117 - EU:
52.28.51.217,63.183.235.155,3.77.251.32
Static IPs are how a performance test reaches a target that isn’t exposed to the public internet. The load still comes from Postman’s cloud infrastructure, and you allowlist the addresses it sends from. This is a different mechanism from the runners you set up inside your own network to monitor internal APIs, which don’t run performance tests.
Run a performance test with setup and teardown collections
Setup and teardown collections let you run preparation and cleanup steps once for a performance test. The setup collection runs one time before the test starts, and the teardown collection runs one time after the test ends. Setup and teardown are attached to the performance run configuration itself, so the same collections and behavior carry over no matter whether you start the run from the Postman app, the Postman CLI, or the Postman Cloud. Learn more about configuring a performance test.
Use a setup collection to prepare something your test needs, such as creating an account or requesting an access token. Use a teardown collection to clean up afterward, such as deleting the data the test created.
Setup and teardown are each a full collection, not a single script, so you can create, version, and reuse them like any other collection. Each can contain multiple requests and folders and use its own authorization.
You can also run setup and teardown collections from your local machine or CI/CD pipeline using the --setup-collection and --teardown-collection options with the Postman CLI. Learn more about running setup and teardown collections with the Postman CLI.
How setup and teardown run
Setup and teardown each run only once, no matter how many virtual users you use, while the test itself runs repeatedly for every virtual user. The run happens in this order:
- The setup collection runs first and completes before the test starts.
- The test runs. Each virtual user runs the selected requests in a repeating loop for the test duration.
- The teardown collection runs after the test ends, after every virtual user has finished or stopped.
If the setup collection fails, Postman skips the test, still attempts the teardown collection, and marks the run as failed. The teardown collection runs on every outcome, including when the run completes, is canceled, fails, or times out.
You can track the progress and outcome of each collection in the run’s Activity log, where setup and teardown appear as separate stages.
This order and failure behavior are the same no matter how you start the run.
Pass state between phases
Setup, test, and teardown share state through environment variables. For the duration of the run, Postman uses a copy of the selected environment. When the setup collection writes a variable, Postman applies it to this copy, then passes the updated environment to the virtual users and the teardown collection.
Changes that the setup collection makes apply only to the current run. Postman doesn’t write them back to the saved environment.
Variables that your requests write during the test itself aren’t available to the teardown collection, which receives the environment as it was after the setup collection ran. If the teardown collection needs a value, set it in the setup collection rather than during the test.
Rename a performance run
You can change the name of a performance run while it’s in progress, or you can rename a past run. Rename a performance run to help you identify runs later, for example, when comparing performance runs.
To rename a performance run, start a new run or open a past run. Click the name of the performance run and enter a new name.
View past performance runs
You can view a list of past performance runs for a collection. Open the collection, select the Runs tab in the workbench, then select the Performance tab.
You can view metrics for each run, including the number of virtual users, duration, total number of requests, requests per second, average response time, and error rate. Click the run to view a graph and full details for the performance run.