View metrics for performance tests
During a performance test, all requests are sent from your computer where you’re running the Postman desktop app. You can view real-time metrics such as the average response time, error rate, test assertion failure rate, and throughput. You can also customize the performance test graph to focus on the requests or test metrics you’re most interested in.
To understand how your API’s performance has changed over time, you can choose two performance runs and compare metrics between them.
View performance metrics
During the performance test, the Summary tab displays performance metrics in real time so you can monitor how your API behaves under load as the test runs. Real-time visibility enables you to identify sudden increases in response time, failed assertions, and request errors. You can stop the test, make adjustments to your configuration or API, and rerun the test without waiting for the full run to complete.
After the test completes, you can review detailed information for any test assertion failures and errors that occurred during the performance test.
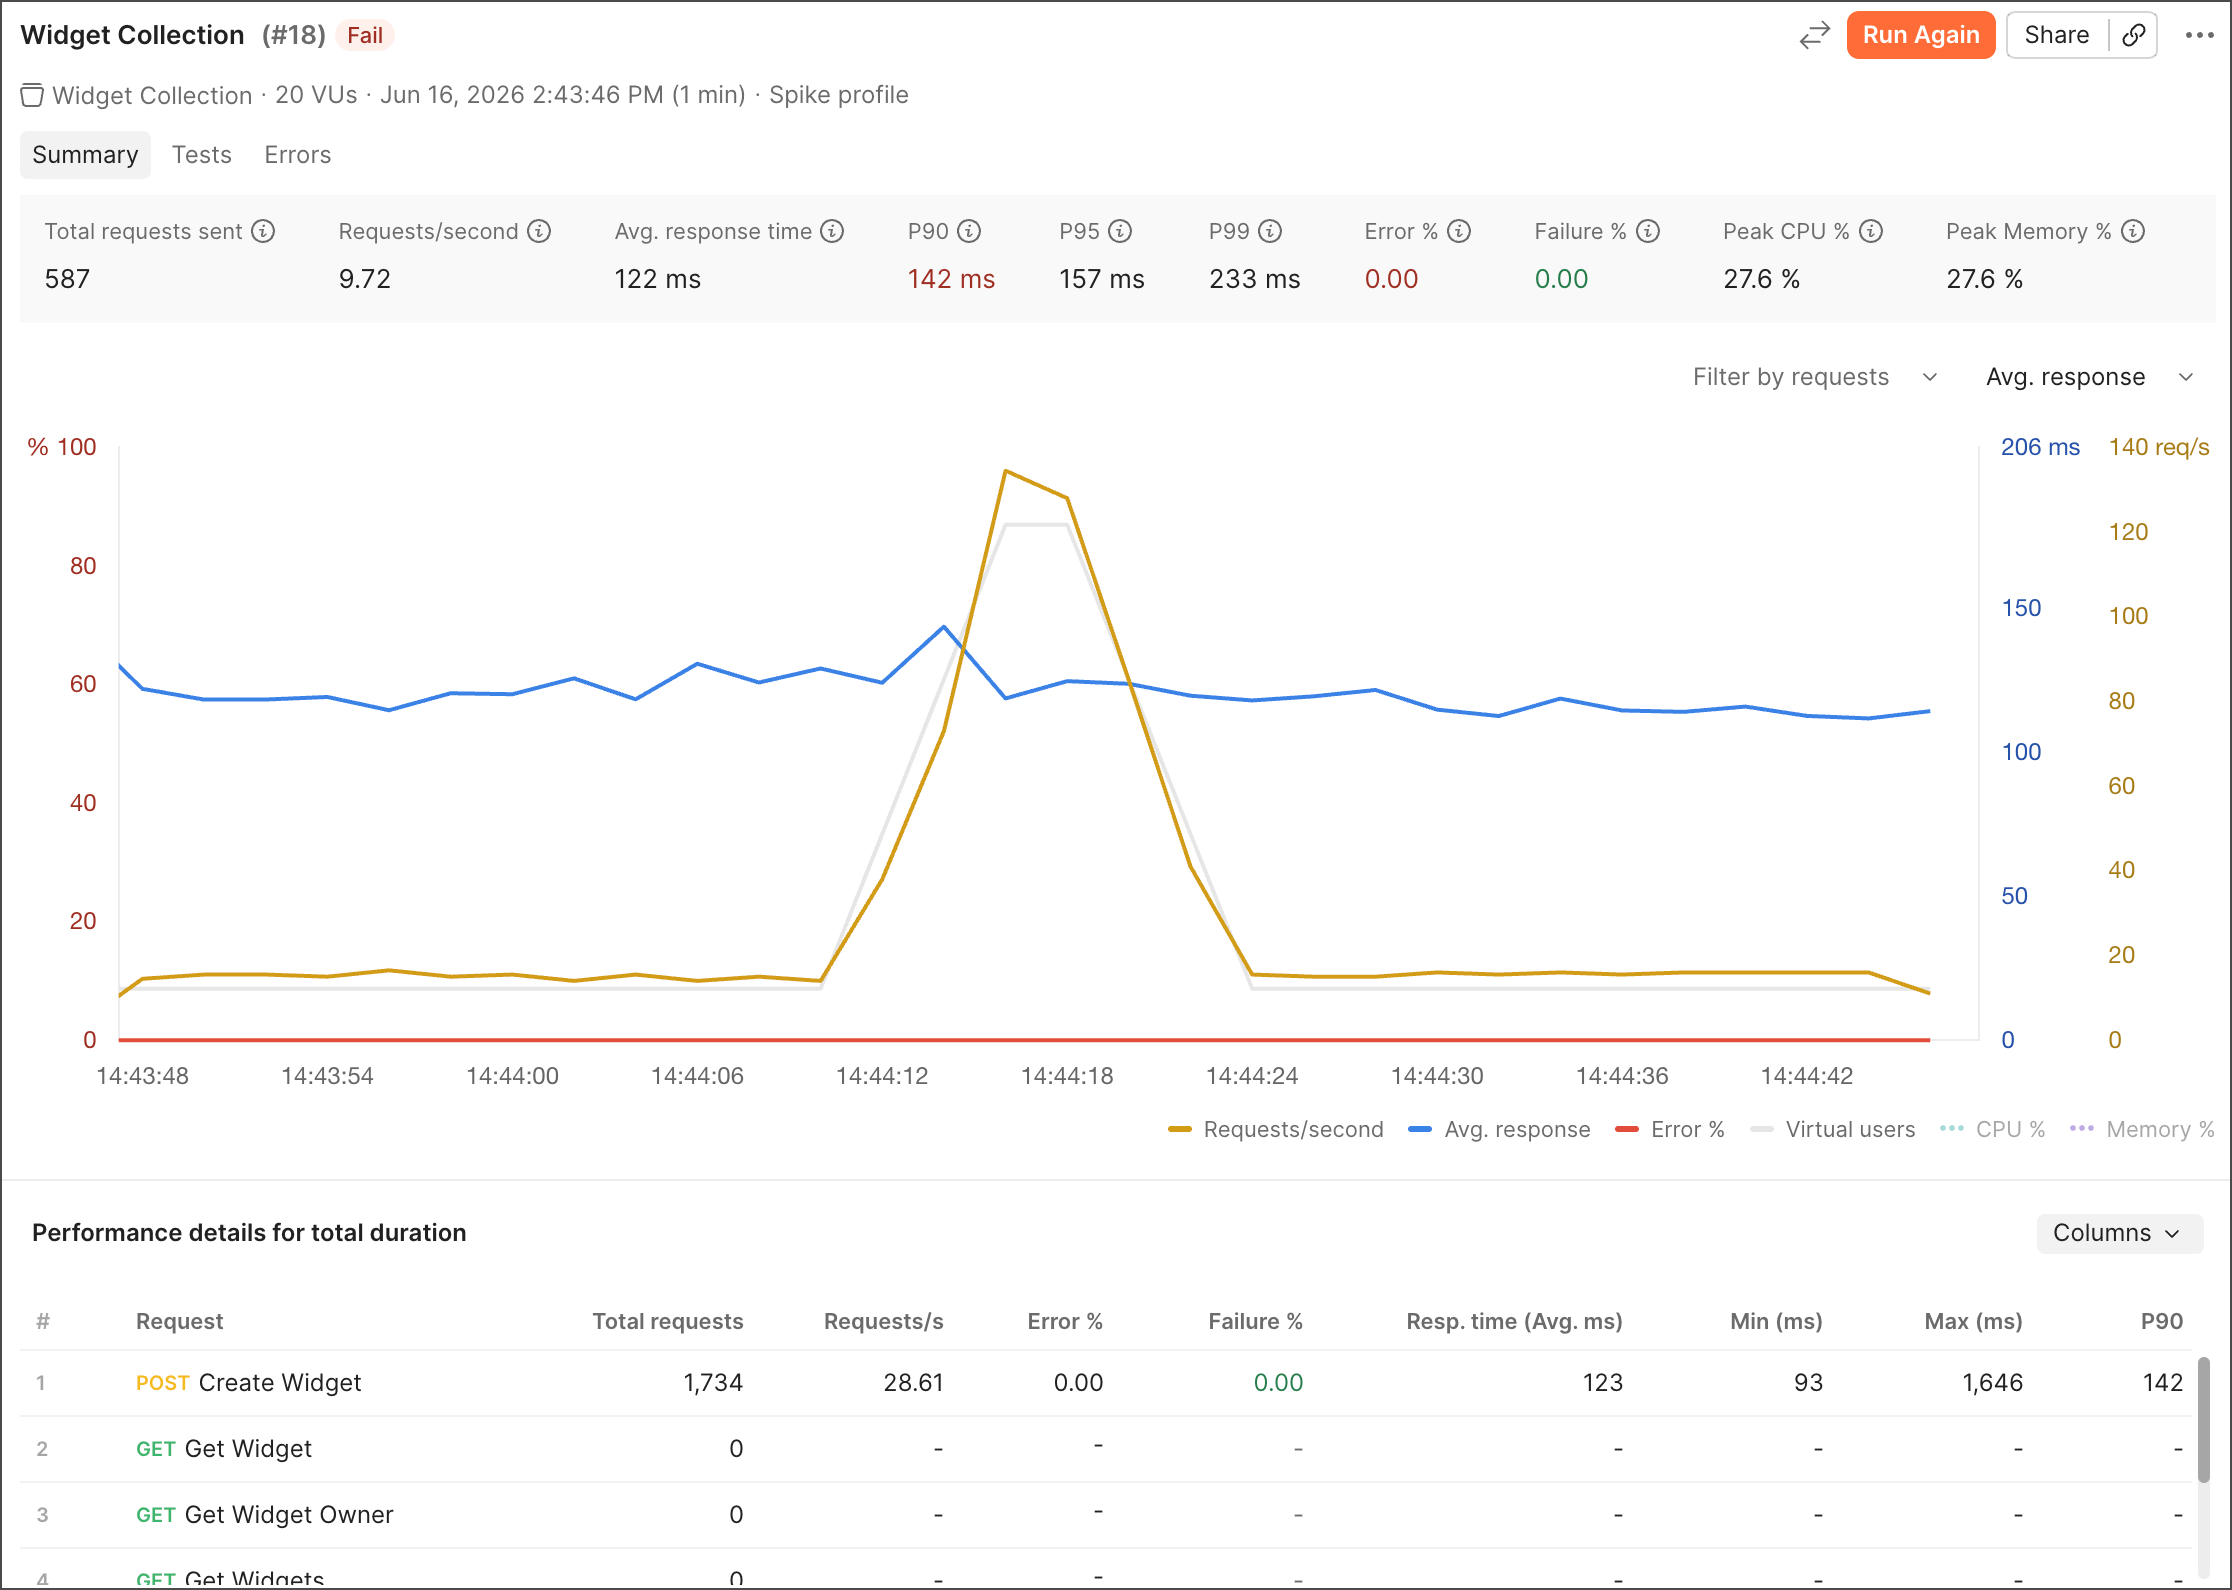
You can view the following information about the performance test:
- Name of the collection running and its active environment (if any). Click the name to open the collection or environment.
- The number of virtual users (VU). Each virtual user simulates the behavior of a real-world user by running the collection in a repeating loop, in parallel with other virtual users.
- Start time, duration, load profile (fixed, ramp up, spike, or peak), and data file (if used).
- Whether the test passed or failed based on the metric, condition, and value.
- Total requests sent — The total number of requests sent across all virtual users.
- Requests/second — The number of requests sent each second during the performance test, a measure of throughput.
- Avg. response time — The response time in milliseconds of all requests averaged together.
- P90 — The 90th percentile of response times, in milliseconds.
- P95 — The 95th percentile of response times, in milliseconds.
- P99 — The 99th percentile of response times, in milliseconds.
- Error % — The percentage of requests that result in an error. Errors indicate runtime issues such as timeouts, connection or TLS failures, or uncaught exceptions in user scripts.
- Failure % — The percentage of requests with at least one test assertion failure.
- Peak CPU % — The peak CPU usage percentage for your system during the performance test.
- Peak Memory % — The peak memory usage percentage for your system during the performance test.
Learn more about viewing system CPU and memory usage.
On the Summary tab, you can take the following actions:
- Click Stop to stop the performance test.
- Click Run Again to configure and start the performance test again.
- To compare the current run with a previous run, click
 Compare runs.
 - To get a link to the performance report, click Share. Click
 Copy link to copy the link to your clipboard. You can share the link with your teammates so they can view the results of the performance test.
 - To download a copy of the performance report in JSON format, click
 and select Export JSON. You can also download a copy of the report in PDF or HTML format, but these options are deprecated. The report includes response time and throughput, slowest requests, requests with the most errors, metrics for each request, and a list of errors.
 - To view a list of all past performance runs for the collection, click and select View all runs.
- To delete a performance run, click and select Delete. Click Delete to confirm.
- Click the Columns dropdown list to customize the columns in the table below the graph. You can choose to display or hide columns, such as total requests, throughput, and response time.
- To open a request, click the name of a request.
Exporting performance reports is available on Postman paid plans. For more information, see the pricing page.
Customize the performance view
The Summary tab displays a graph with real-time metrics for virtual users, requests per second, average response time, and error rate percentage.
Hover over a point on the graph to view more details about the performance test. Click a metric in the legend below the graph to show or hide that metric in the graph.
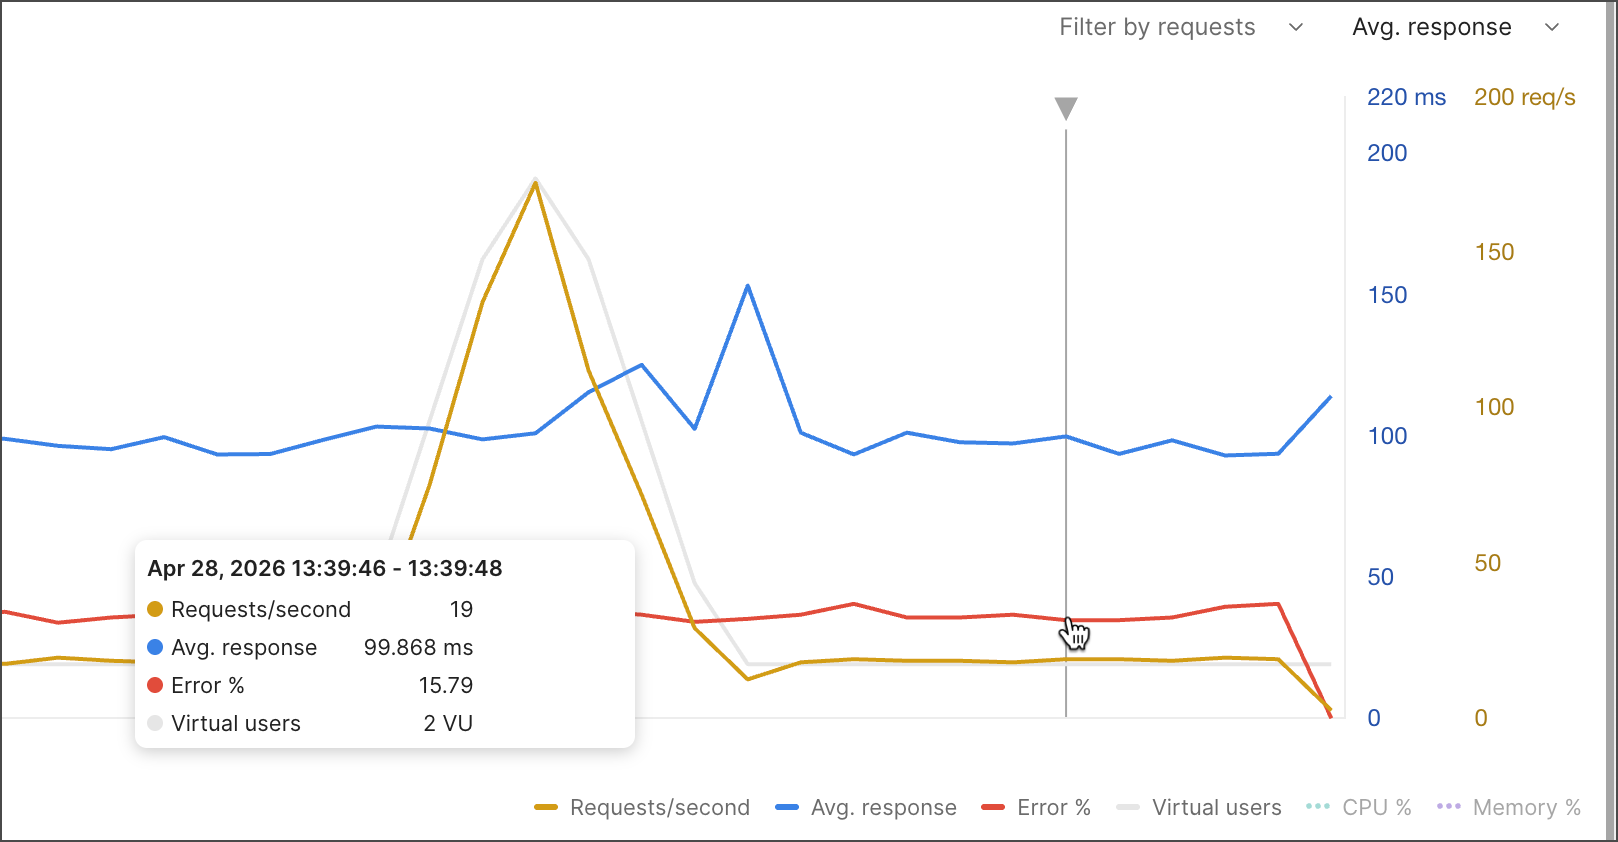
Use the dropdown lists to view data for a specific request. You can also select the response time metrics you want to view. The following metrics are available:
- Avg. response — The response time in milliseconds of all requests averaged together.
- Min response — The lowest observed response time.
- Max response — The highest observed response time.
- 99th percentile — 99% of all response times are equal to or less than this value.
- 95th percentile — 95% of all response times are equal to or less than this value.
- 90th percentile — 90% of all response times are equal to or less than this value.
To change the graph back to the default view, click Reset.
To view details for a section of the graph, select a point on the graph. The table below the graph displays the total requests, throughput, response time, and error metrics for each request during the selected time period. To change the graph back to the default time period, click Clear filter.
Compare two performance runs
APIs in service tend to change with the addition of new features, improvements, and bug fixes. Over time, these changes can have an impact on the API’s performance.
To understand how the performance of your API has changed over time, you can compare performance runs. Select two runs to compare, and Postman displays the difference between the two runs for various performance metrics.
Make sure to name your performance runs so it’s easier to identify them when comparing runs.
To compare two performance runs, do the following:
-
Open the past performance run you want to compare other runs to. This is the reference run.
-
Click
Compare runs to enter comparison mode. -
Click Select run to compare with and choose a performance run to compare to the reference run. Select a recent run from the list, or search for a run by name.
-
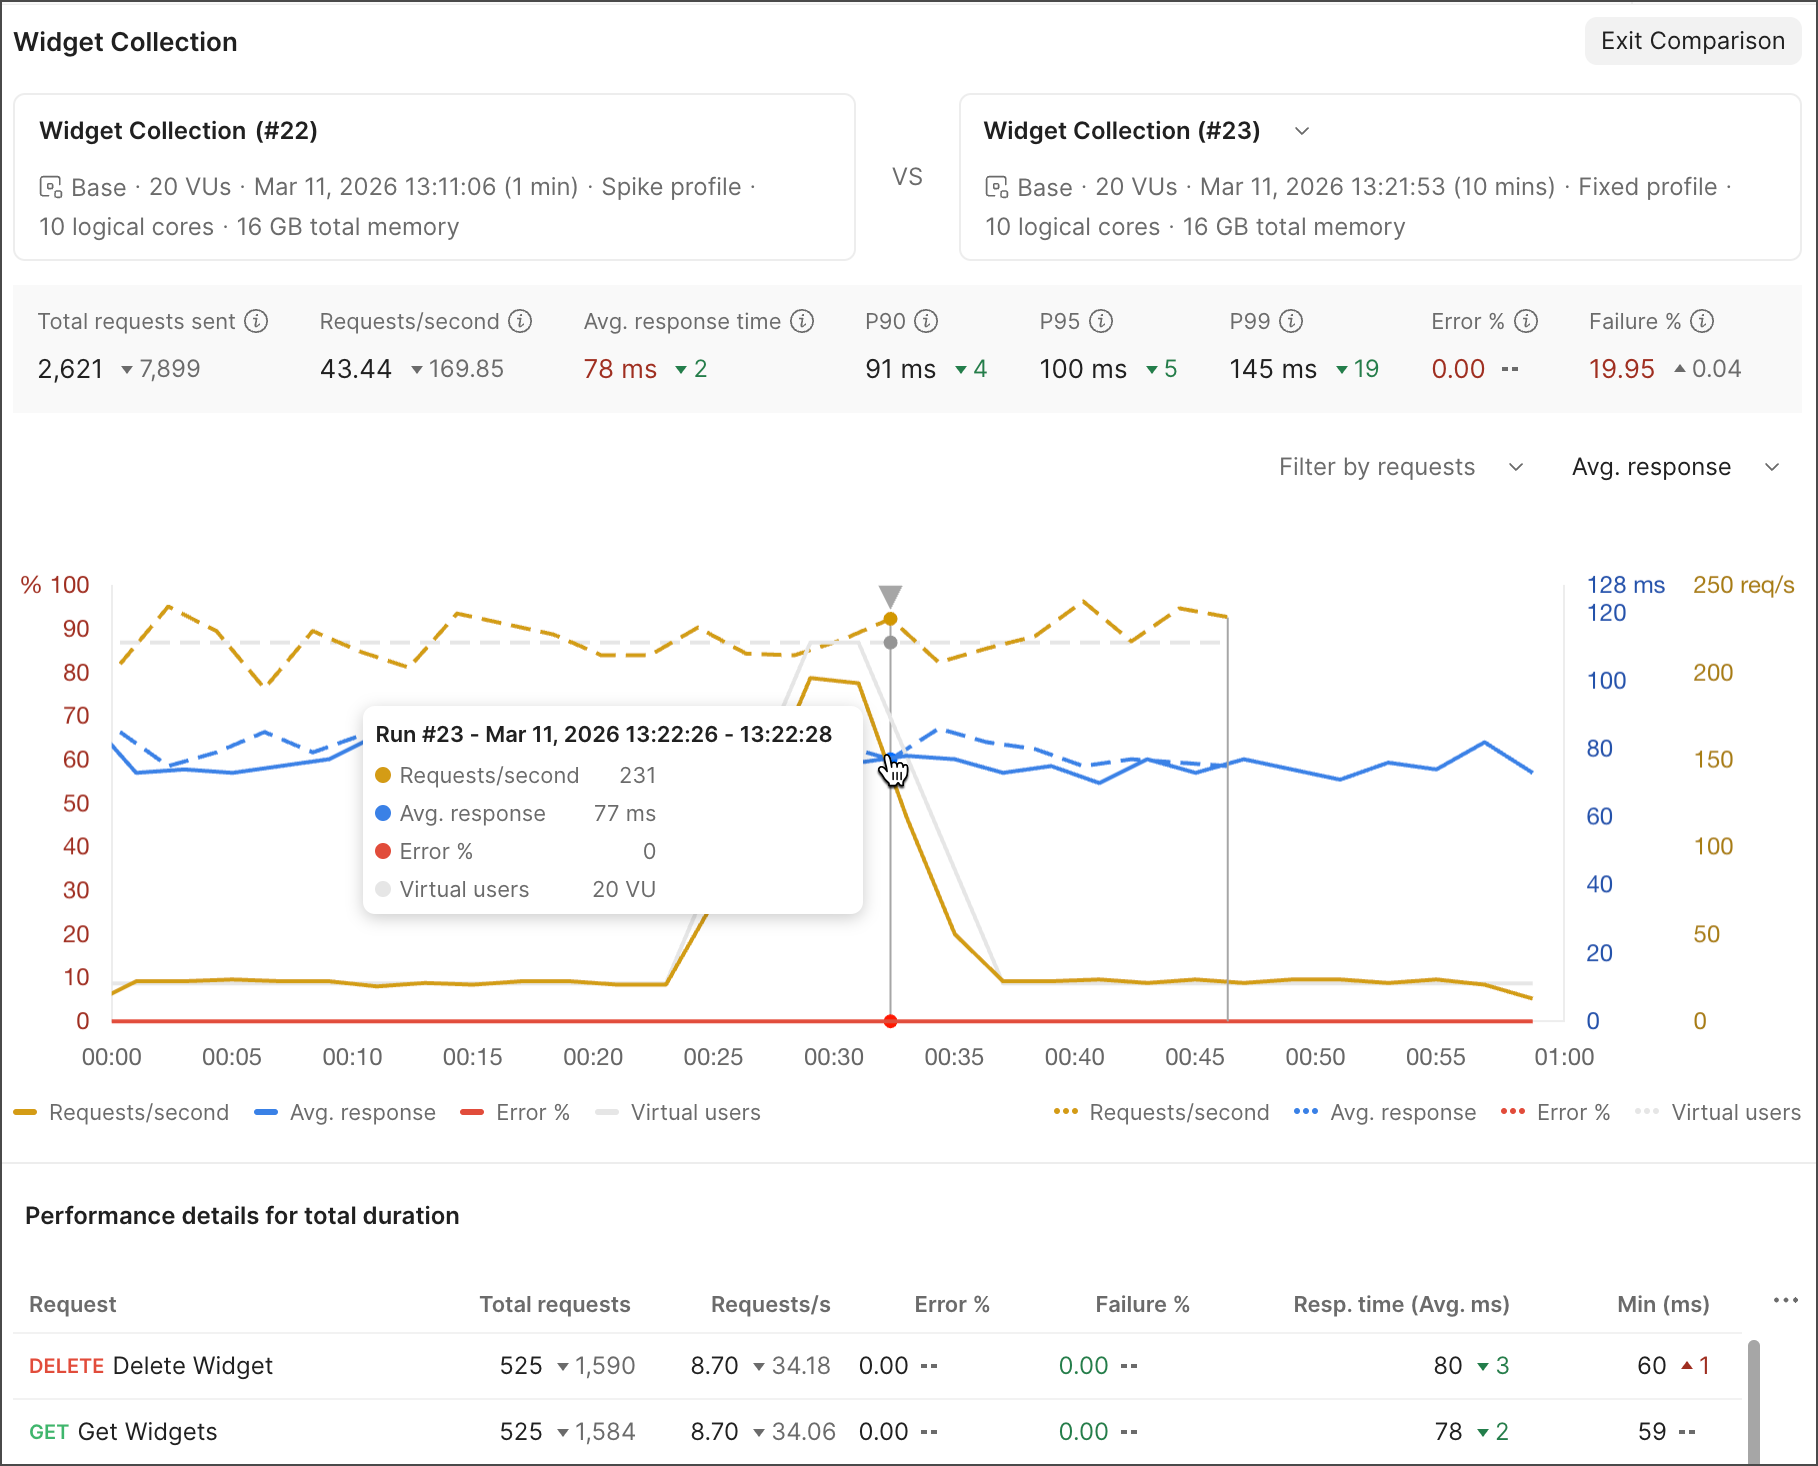
Use the performance view to compare the selected runs:
- The graph display performance data for the reference run (solid lines) and the comparison run (dotted lines). Hover over a point on the graph to view more details.
- The table below the graph displays how values in the comparison run differ from the reference run. A value in green (▼) indicates better performance and a value in red (▲) indicates worse performance. Values in gray indicate differences that aren’t necessarily better or worse.
- You can customize the performance view to display the metrics or requests you’re most interested in comparing.
- At any time you, can choose another comparison run in the list.
-
When you’re finished comparing performance runs, click Exit Comparison.