Troubleshoot monitors in Postman
If you encounter a problem with a monitor, the following troubleshooting steps may help you identify and resolve the issue.
View failed monitors
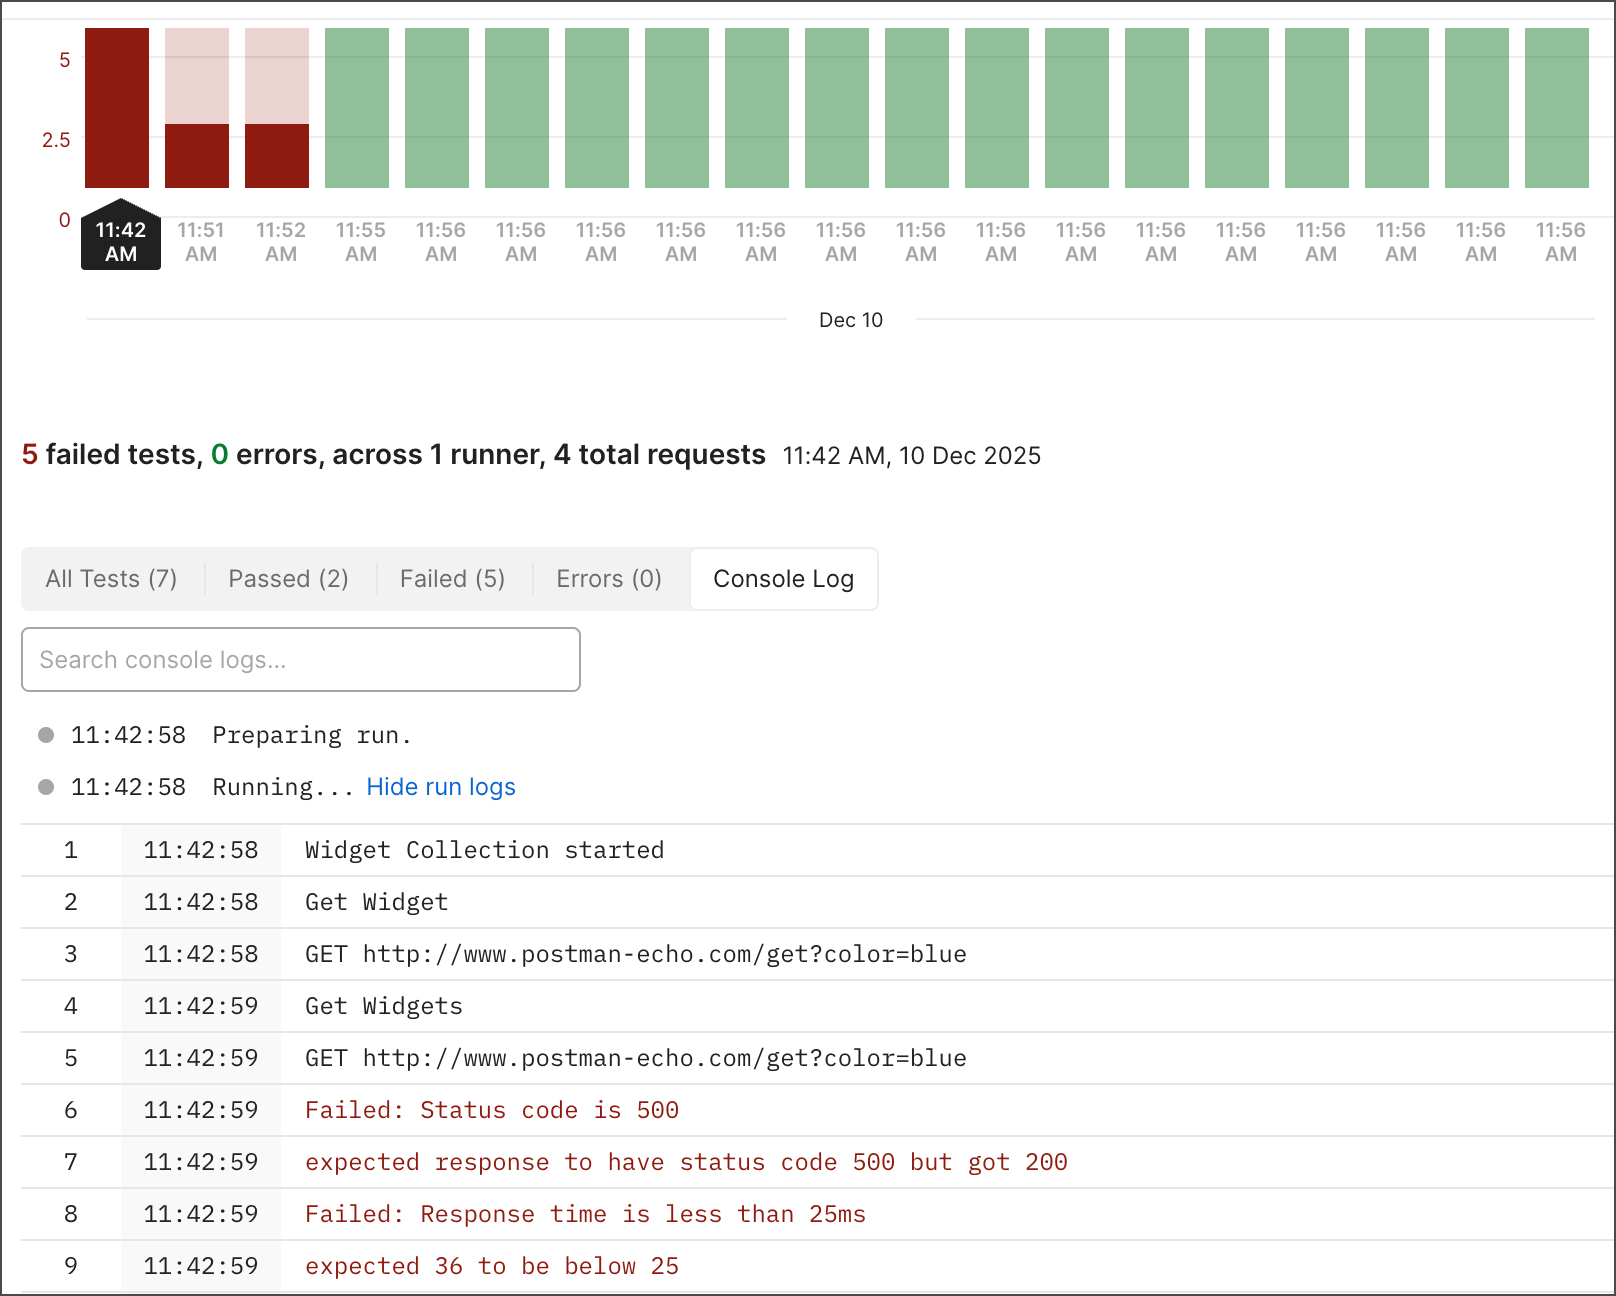
The Console Log can help you debug issues you might encounter with your monitors.
- Go to your workspace and click the
 Services tab and expand Monitors in the sidebar.
 - Select a monitor, and then click a failed monitor run in the performance graph.
- Click Console Log to view monitor run details, along with any
console.log()statements you included in your pre-request and post-response scripts. - (Optional) Click Search console logs and enter a search term like “error” or “failed”. Matches are highlighted in the log. You can also click
 Next match and
  Previous match to cycle through them.
For more information on debugging with the Postman Console, see Troubleshooting API requests.
Debug local run attempts
- Run the failing monitor’s collection with its environment in Postman or the Postman CLI.
- If a local run passes, check that your changes are automatically syncing to Postman Cloud.
Debug variable issues
- Ensure that the same environment is used across local runs and monitor runs. To confirm, add
console.log(environment);to your request scripts and compare the results across monitoring and local runs. - Ensure that any collection or environment variables that your collection run depends on have been shared. Because they run in the Postman cloud, monitors can only use variables whose values have been shared. (Sharing syncs variable values to the Postman cloud.)
- If your collection run depends on a saved global variable, change it to an environment variable, and share its value. Saved global variables aren’t supported in monitors.
Log relevant information
-
Unexpected response bodies or header values can be a source of monitor issues. You can log these with the following code:
Uncaught errors
- Wrap suspicious code in a
try - catchblock to ensure test and pre-request scripts in your collection run to completion.