View reports in Postman
Reports are available with all Postman Enterprise plans. The Public workspace metrics report is available with all Postman plans. For more information, see the pricing page.
Postman generates reports that visualize how your organization uses Postman across workspaces, and provide information about your plan and billing. You can use reports to understand how your team uses Postman, identify trends in your API usage, and make informed decisions about scaling your organization.
Reports data refreshes every hour, except for the Active users metric, which refreshes daily.
You can access reports in your Postman reports dashboard. From your homepage, click Reports in the left sidebar.
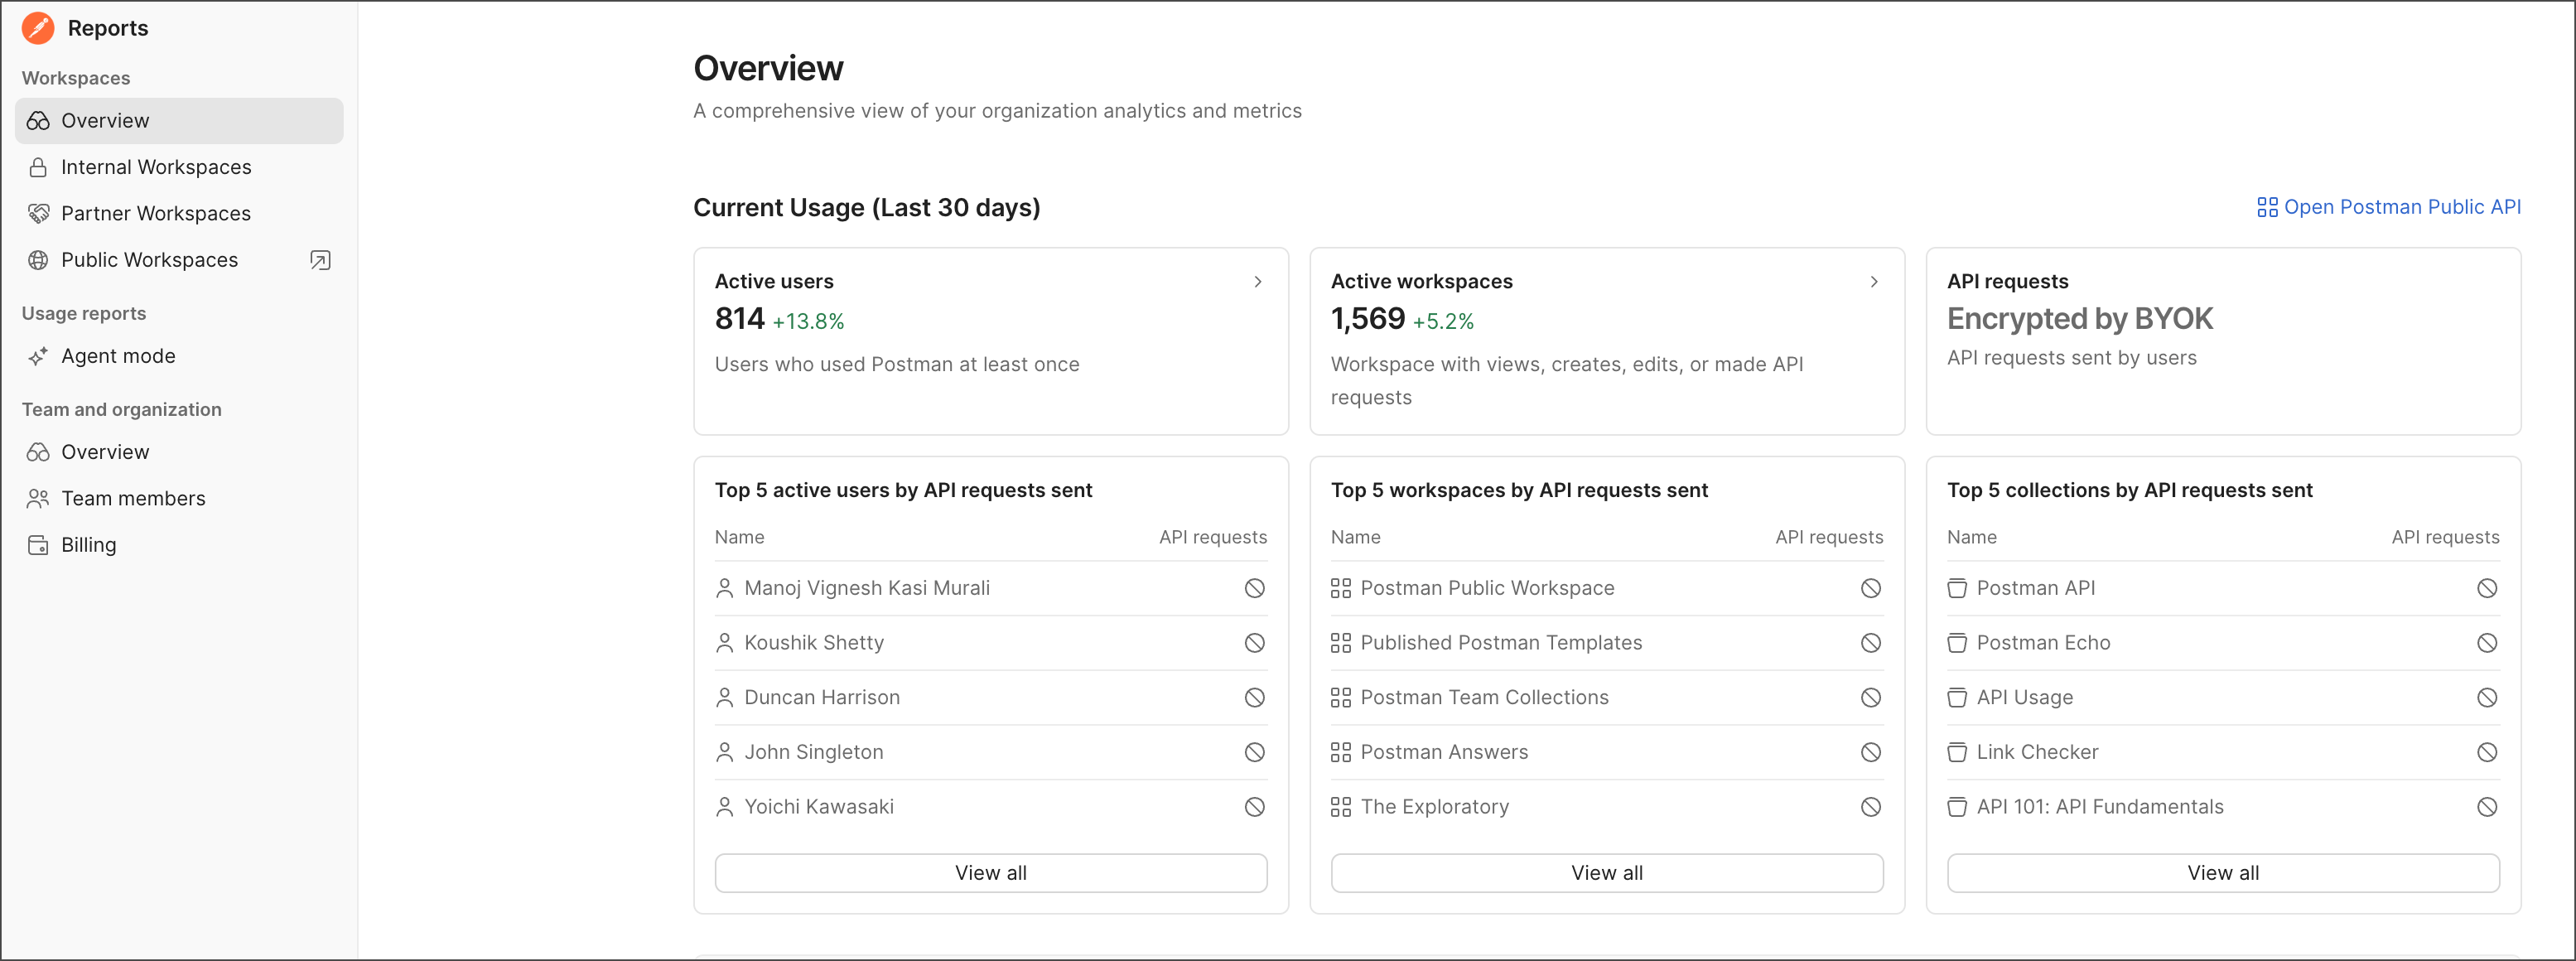
Reports are broken down into Workspaces, Usage reports, and Team and organization sections:
-
Workspaces reports — View activity across your internal, partner, and public workspaces, including active users, active workspaces, API calls, and usage trends over time.
-
Usage reports — View and monitor Agent Mode usage, performance metrics, and user activity across your workspaces.
-
Team and organization reports — View member and plan related information, including active members, plan limits, and billing information.
Report permissions
In a report, your level of access determines what data is available to you. For example, to see the billing report, you need to have a Billing role. To learn more, see Define roles and permissions within a Postman team.
Explore reports and report data
To explore reports, select items in the Reports dashboard sidebar. Some report items have a link that opens another related report.
To explore data in a report, hover over a data point to show the data point’s value. Then, click a data point to drill down and view more details. Sort the table by clicking a column heading. Hover over a table row and click the arrow to go to a related report or element.
You can also explore Postman’s analytics reports programmatically using the Analytics endpoints in the Postman API. For more information, see the Postman Public Workspace.