Automate collection runs on a schedule
Instead of running collections manually, Postman can run collections for you on a schedule. Use the Collection Runner to select a collection and configure a schedule. For example, you can run a collection that tests the functionality of your API every day at a specific time.
When you schedule a collection run with the Collection Runner, the scheduled run is added to the Runs > Scheduled tab in the collection. From here you can view, pause, edit, and delete scheduled collection runs.
You can also schedule collection runs with monitors. Schedule runs with monitors when you want to set up alerts, like triggering on-call alerts for failures. For all other use cases, such as automating API tests, schedule runs with the Collection Runner.
About scheduled collection runs
When working with scheduled collection runs, keep in mind the following:
- Scheduled collections run in the Postman Cloud, not locally.
- Scheduled runs don’t support requests that use files in your local working directory to send body data. Instead, upload your test data files to make them available for scheduled runs in the cloud.
- Schedules share permissions with their collections. For example, if you have permission to edit a collection, you can edit that collection’s schedules.
- You can schedule collection runs in personal, private, and team workspaces.
- If you import or export a collection, its schedules don’t import or export with it. However, if you delete a collection, its schedules are also deleted.
- Scheduled collection runs share the same usage limits as monitors.
- Scheduled runs don’t support OAuth 2.0 authentication. To learn how to use an OAuth 2.0 token with scheduled runs, see OAuth 2.0 overview.
You can run collections with scripts that import packages from your team’s Postman Package Library. Learn how to add packages to the package library, and import packages into your scripts.
Schedule a collection run
You can schedule a run for the requests in a collection or a folder.
-
In the sidebar, click
 Items, then expand Collections. Select the collection or folder you want to schedule.
 -
Click
 Run. Or, click Tools > Runner in the Postman footer, then drag a collection from Collections in the sidebar.
 -
Under Run type, select Functional. Then under Run method, click Schedule.
Scheduling is available in Cloud View only.
-
Choose any of the following configuration options:
-
Schedule name — A name for your scheduled run.
-
Run Frequency — When and how often you want the collection to run. This can be as often as every five minutes for a status page, or a basic check once a week or month on your endpoints.
Only paid plans can schedule minute-based schedule runs. For Enterprise plans, you can schedule minute-based scheduled runs to run every one minute.
-
Environment — (Optional) The environment with variables you want the collection to use.
-
Iterations (max 50) — The number of times to run the collection.
-
Data file — A data file for the scheduled run.
-
Email notification recipients — Up to five team members who will receive notifications for the scheduled run.
-
Stop notifications after N consecutive failures — The number of consecutive failed runs after which Postman stops sending notifications. The default is three.
-
Click
 Advanced settings for more configuration options:
- Retry if run fails — Select this checkbox to retry a request after it fails, and enter the number of times to retry the request. Each retry counts toward your monitoring usage.
- Set request timeout — Select this checkbox to skip a request after it times out, and enter the timeout period in milliseconds. A scheduled run can’t exceed a total duration of 15 minutes.
- Set delay before requests — Select this checkbox to wait before sending requests, and enter the interval delay in milliseconds.
- Follow redirects — Clear this checkbox to prevent requests that return a 3xx series response from automatically redirecting.
- Enable SSL validation — Clear this checkbox to prevent Postman from checking the validity of SSL certificates when making requests.
-
-
By default, your requests run in the sequence they’re listed in the collection. If you need to change the run order, click
 and drag a request to its new location in the order. You can also remove an individual request from the run by clearing the checkbox next to its name. For more information, see Change run order.
 -
Click Schedule Run.
Requests sent by scheduled collection runs are deducted from your maximum number of monitoring API calls. For more information about checking your monitor usage, see Manage monitor usage in Postman.
View a scheduled run
You can view the results of past scheduled runs.
-
In the sidebar, click
Items, then expand Collections. Select the collection with the scheduled run you want to view. -
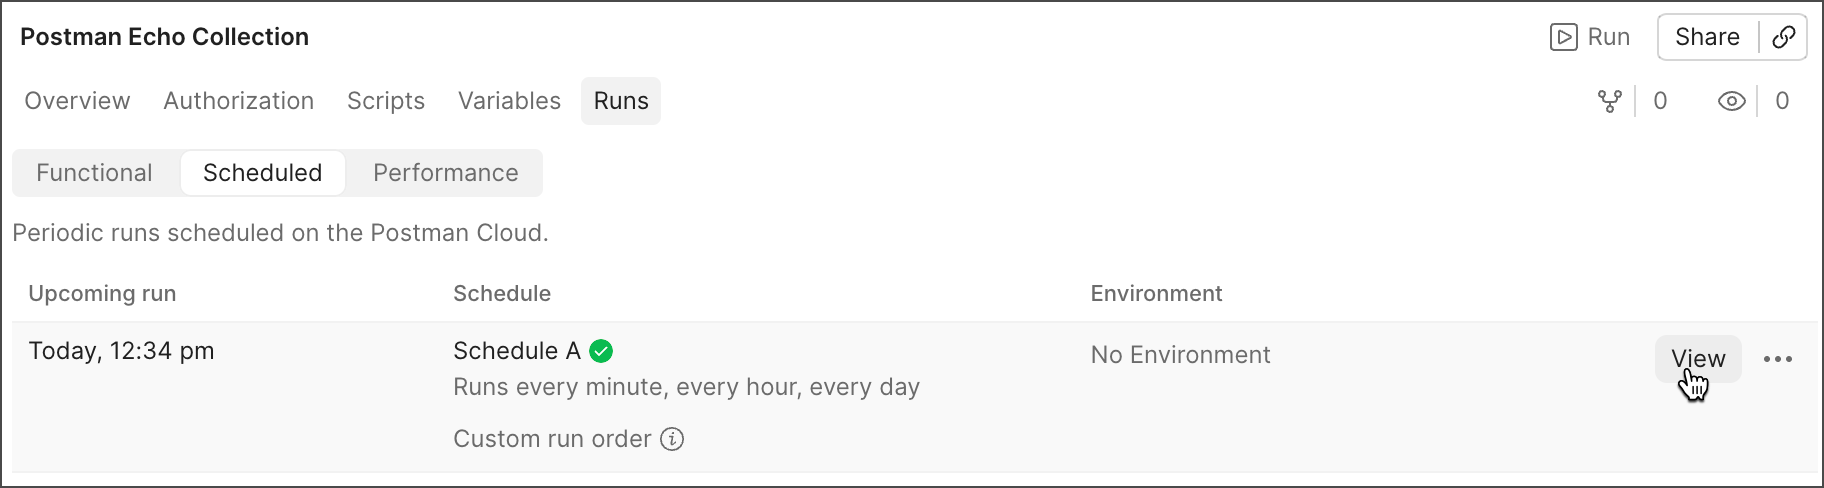
Select the Runs > Scheduled tab.
-
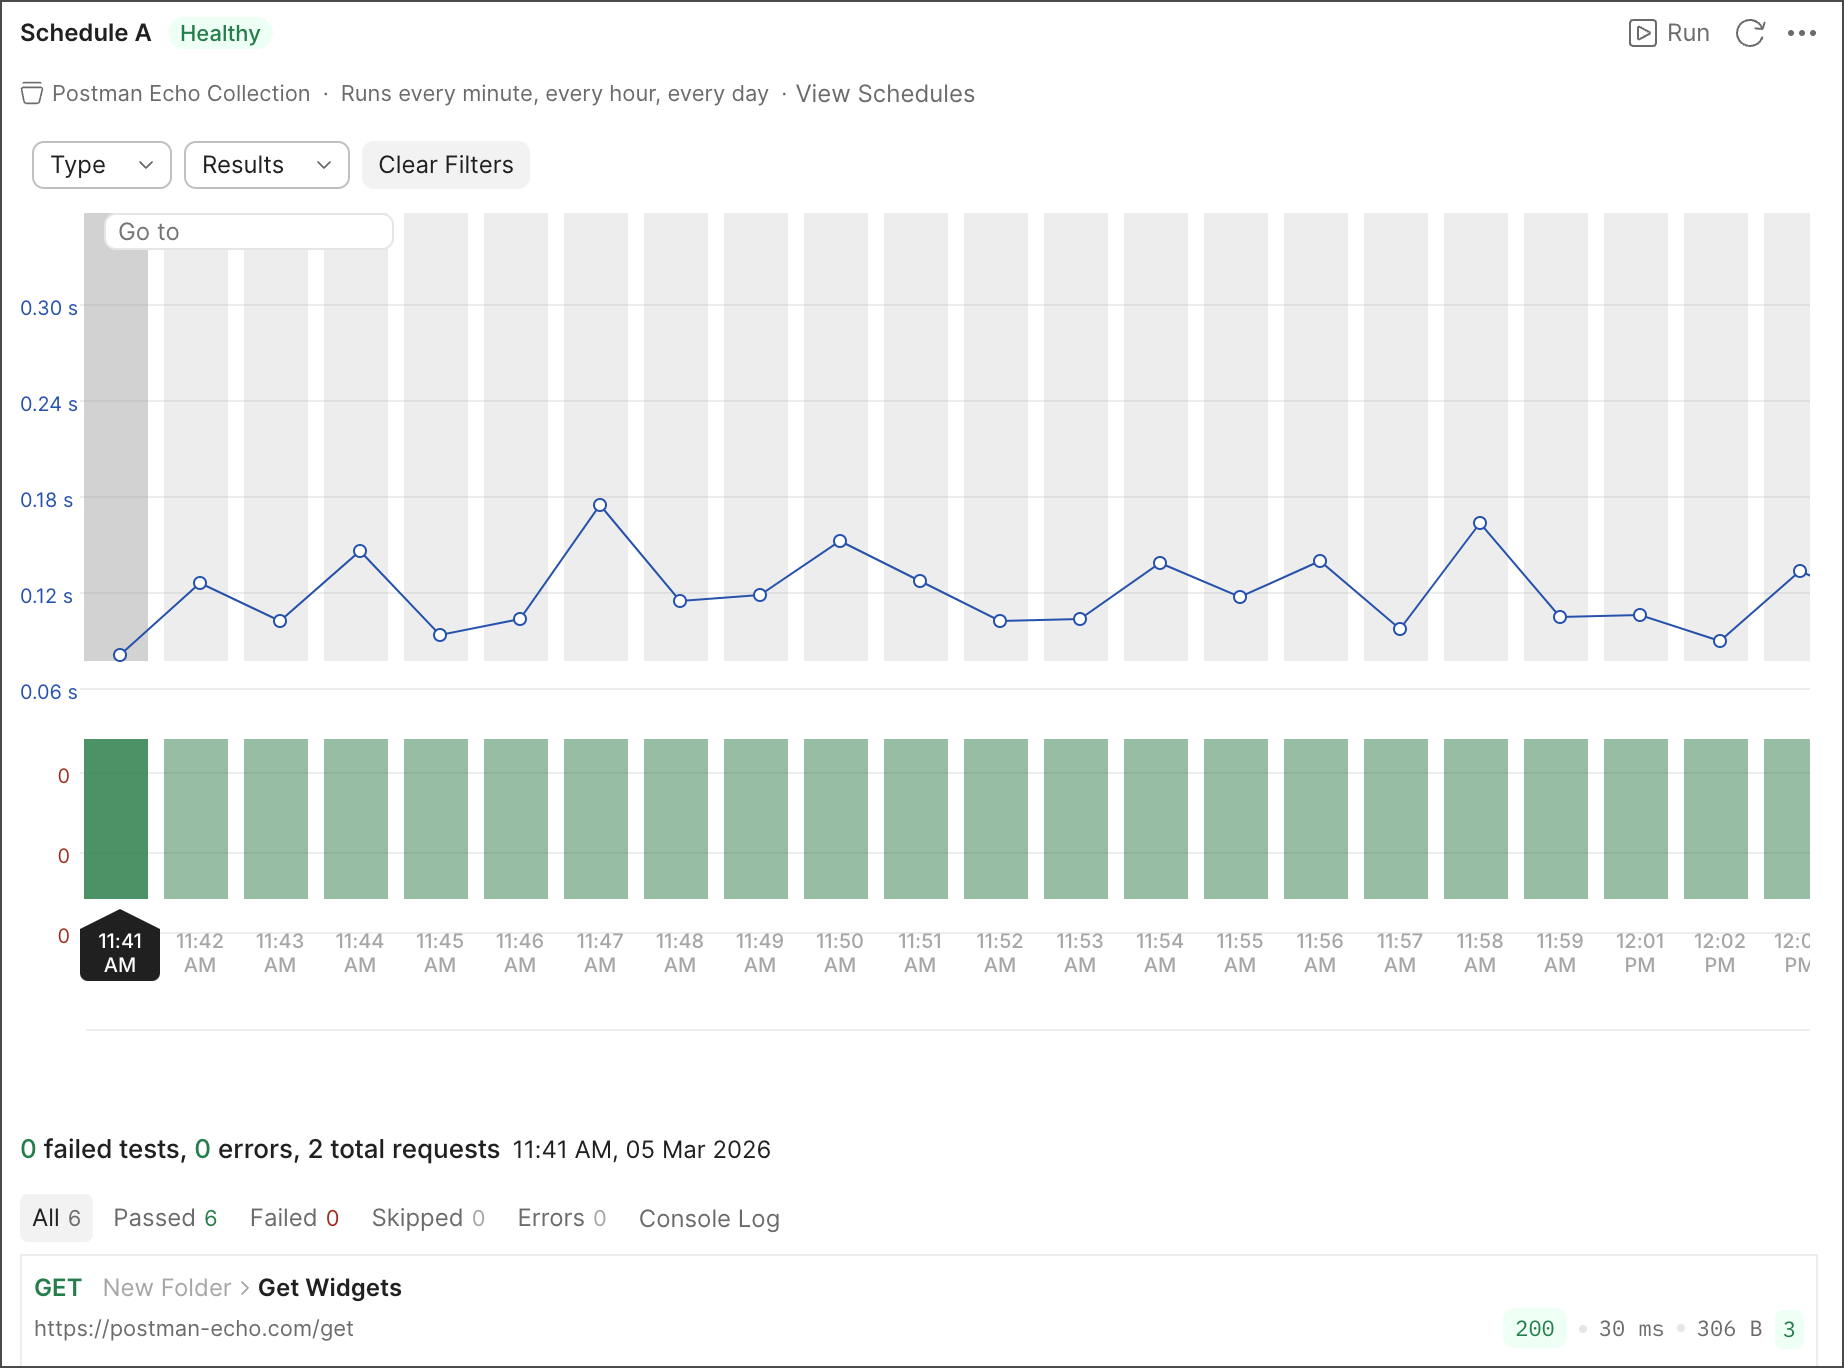
Hover over a scheduled run and click View.
-
Each column in the graph represents an individual run. Click a column to view test results and the Console log for that run. For more information see View scheduled collection runs in Postman.
Manually run a scheduled run
When a scheduled run is triggered manually, it runs in the Postman Cloud. Running scheduled runs manually is useful when you are fixing bugs or reproducing issues.
-
In the sidebar, click
Items, then expand Collections. Select the collection with the scheduled run you want to run manually. -
Select the Runs > Scheduled tab.
-
Hover over a scheduled run and click View.
-
Click Run.
Pause or resume a scheduled run
When you pause a scheduled run, Postman won’t run the collection again until you resume the schedule.
- In the sidebar, click Items, then expand Collections. Select the collection with the scheduled run you want to pause or resume.
- Select the Runs > Scheduled tab.
- Hover over a scheduled run, click
 View more actions and select Pause or Resume.
Edit a scheduled run
- In the sidebar, click Items, then expand Collections. Select the collection with the schedule you want to edit.
- Select the Runs > Scheduled tab.
- Hover over a scheduled run, select View more actions > Edit.
- Make any changes to the scheduled run configuration, then click Save Changes.
Change run order
You can send the requests in a collection in different combinations or sequences to simulate various workflows. In the Collection Runner, change the order of requests by dragging them, or clear the checkbox next to a request to skip it.
When you schedule a collection run, you can change the order of your requests and save the custom order to run on a schedule. In this way, you can use the same collection to automate multiple tests scenarios.
To change the request order in a scheduled run, do the following:
- In the sidebar, click Items, then expand Collections. Select the collection you want to change the run order of.
- Select the Runs > Scheduled tab.
- Hover over a scheduled run, click View more actions > Edit.
- Under Run Sequence, click and change the order by dragging and dropping requests. Skip a request by clearing its checkbox.
- Click Schedule Run.
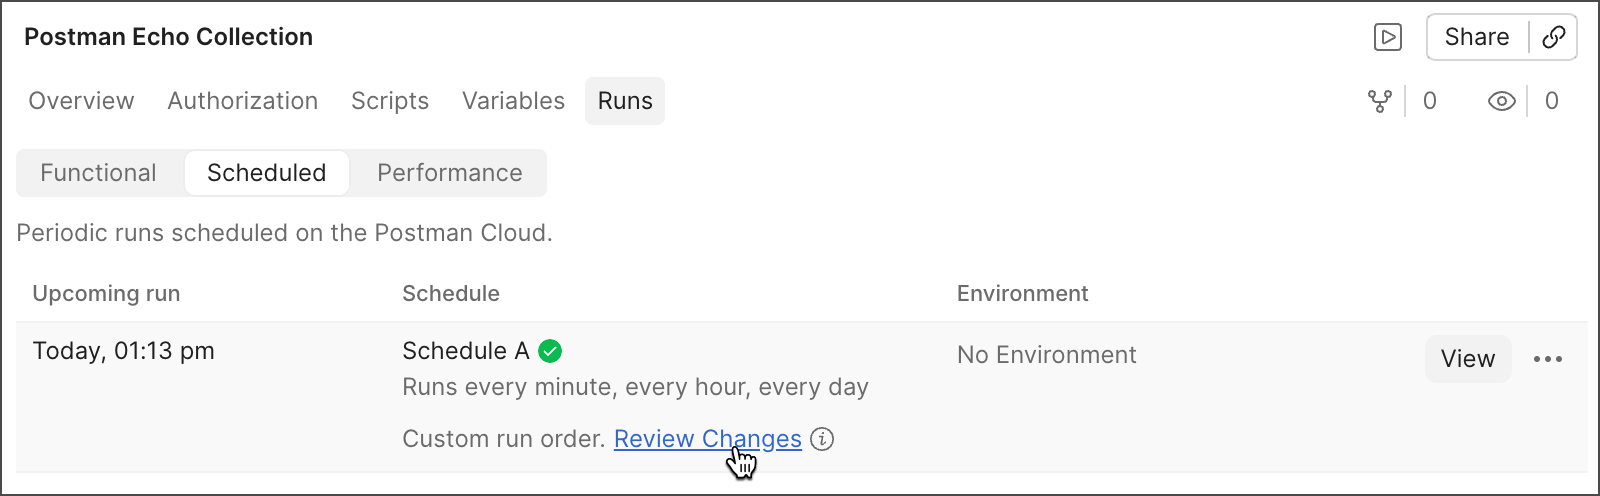
On the Runs > Scheduled tab, the message Custom run order indicates a scheduled run uses a custom request order. If a request is added or deleted from a scheduled collection, a Review Changes link appears next to the scheduled run. Click the link to review and edit the changes.
Requests sent by scheduled collection runs are deducted from your maximum number of monitoring API calls. For more information about checking your monitor usage, see Manage monitor usage in Postman.
Delete a scheduled run
- In the sidebar, click Items, then expand Collections. Select the collection with the scheduled run you want to delete.
- Select the Runs > Scheduled tab.
- Hover over a scheduled run and click View more actions > Delete.