Monitor security findings across your API catalog
Postman’s API Catalog provides security insights so that you can monitor and manage security across your APIs. Connect a Wiz integration for security scanning, then drill into vulnerabilities, exposed secrets, and coverage gaps across your integrated services.
Connect Wiz
To enable security insights in the API Catalog, you’ll use Postman’s integration with Wiz. Only Team Admins can connect this integration in Postman.
Wiz creates the service account for you, with the scopes Postman needs. Follow Wiz’s Postman integration guide to get its Client ID and Client Secret.
Connect the integration
To connect Wiz to Postman, do the following:
-
Add the Postman integration in Wiz. Wiz creates the service account with the permissions Postman needs and gives you the Client ID, Client Secret, API Endpoint URL, and API Authentication URL. Copy all four. The Client Secret can’t be viewed again.
-
Make sure you’re signed in to the correct Postman team. The integration is connected once for the whole team, and only one active Wiz connection is allowed per team. To move an existing connection, disconnect it first.
-
In API Catalog, open Security and click Set up Security, then enter the following fields:
- Client ID
- Client Secret
- Authentication URL
- API Endpoint URL
-
Click Connect to finish linking the account.
Once connected, Wiz-sourced data (exposed secrets, vulnerabilities, and known exploited vulnerabilities [KEV] findings) populate the Security section of API Catalog.
Track security metrics
The Security page in API Catalog gives you a consolidated view of your organization’s security posture across all cataloged services.
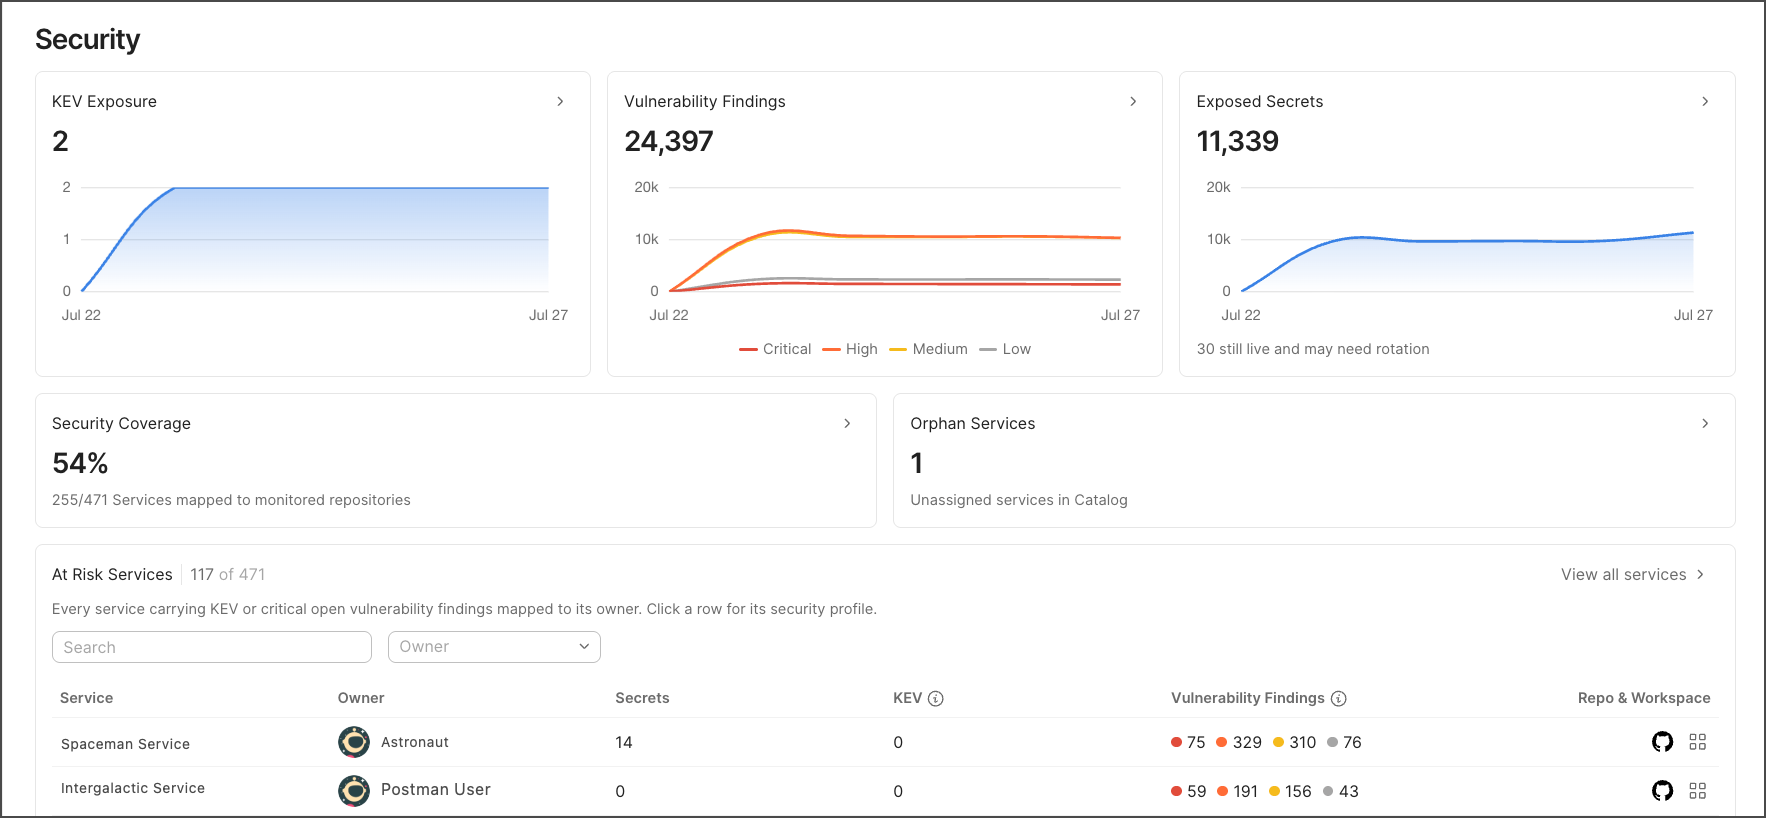
Review security metrics on a recurring basis (weekly or per release cycle). Trends like coverage increasing, critical findings decreasing, secret rotation keeping pace with detection are strong indicators of security health.
Click each metric to drill into a detailed view of the underlying data, including service-level insights and scorecards.
Exposure metrics
The following metrics help you track exposure across your services:
-
KEV Exposure — Total known exploited vulnerabilities (vulnerabilities with confirmed real-world exploitation).
-
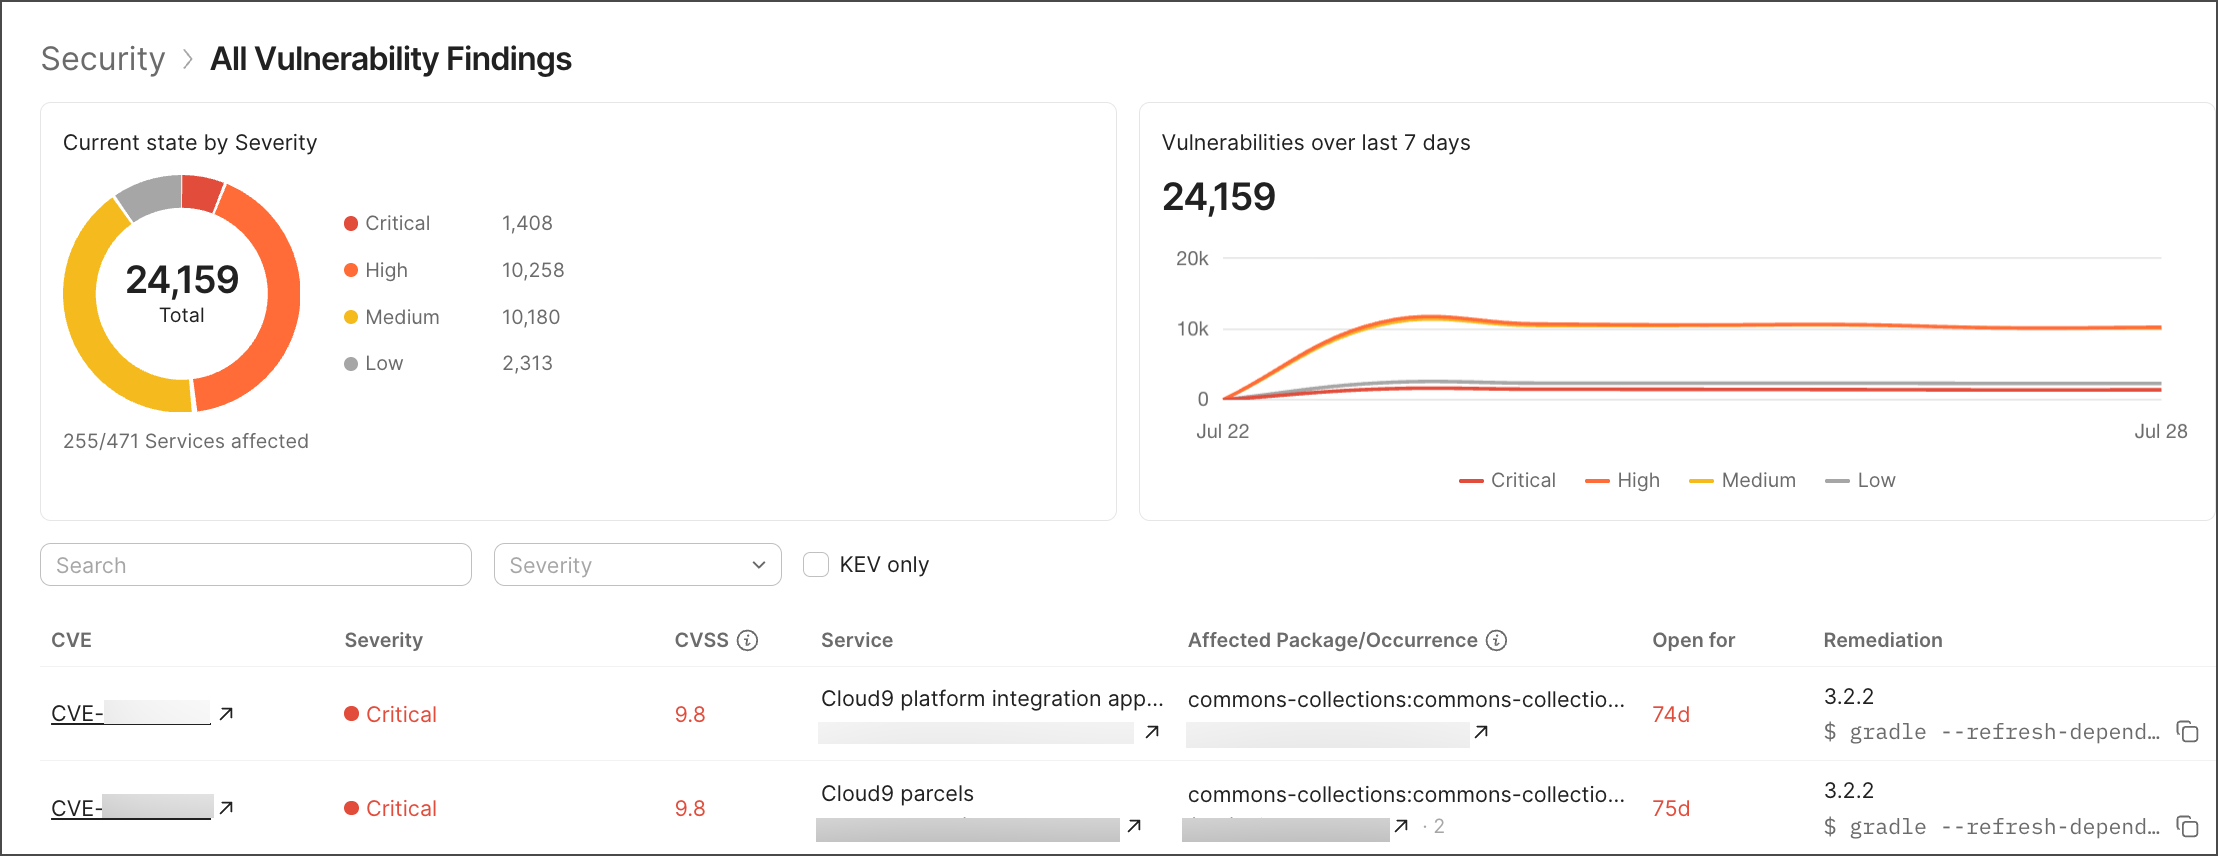
Vulnerability Findings — Open findings across your services, categorized by severity (Critical, High, Medium, Low). Track whether higher-severity findings are shrinking over time relative to lower-severity ones, which indicates remediation efforts are prioritized correctly. Drilling into Vulnerability Findings shows the following:
- A donut chart of current findings by severity.
- A seven-day trend chart of vulnerabilities by severity.
- A filterable table of individual common vulnerabilities and exposures (CVE), including severity, common vulnerability scoring system (CVSS) score, affected service, affected package/occurrence count, how long the finding has been open, and a suggested remediation command.
-
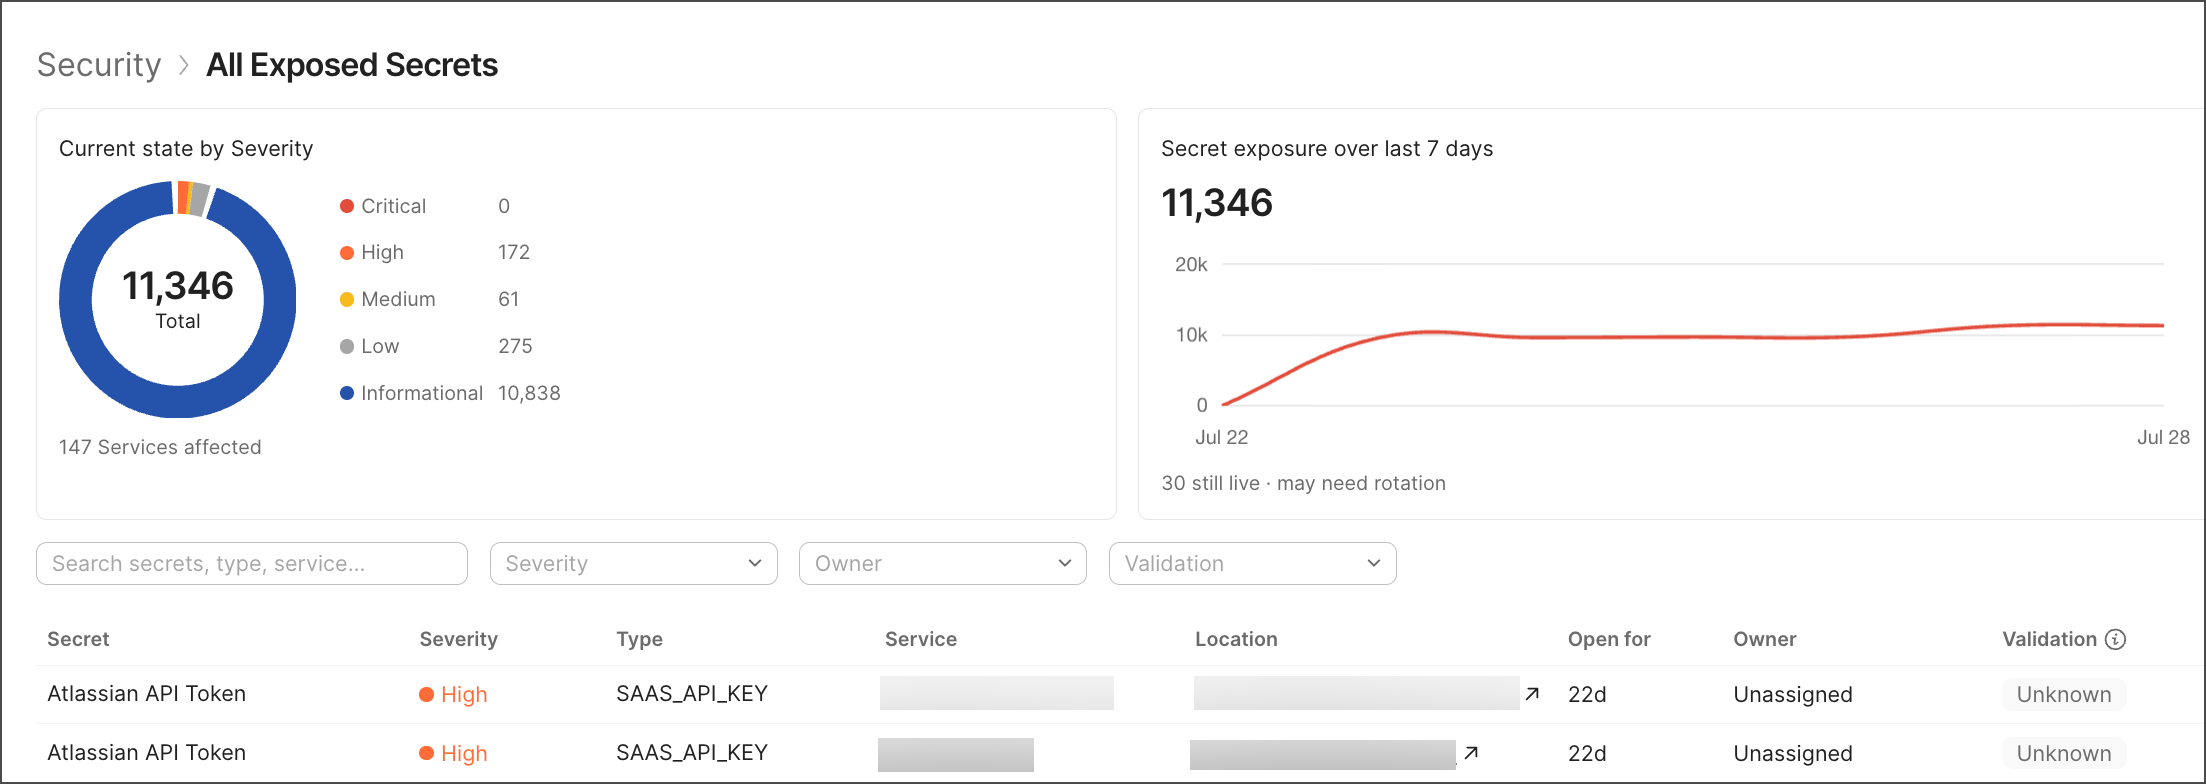
Exposed Secrets — Credentials, tokens, and keys detected in code or configuration. In addition to the total count, this card highlights how many secrets are still active and require rotation. Drilling into Exposed Secrets shows the following:
- A donut chart of secrets by severity.
- A seven-day trend chart of secret exposure.
- A table of individual secrets with title, severity, type, affected service, location, how long the secret has been open, owner, and validation status.
Coverage metrics
The following metrics help you track coverage across your services:
-
Security Coverage — The percentage of your service catalog that is mapped to a monitored repository. Low coverage means blind spots in your security posture. This percentage should trend upward as onboarding and instrumentation mature across teams. Drilling into Security Coverage shows all services with no security signal. They are either not linked to a repository, or linked to a repository that is not matched to a Wiz-scanned repository.
-
Unowned Services — Services with no assigned owner. Unowned services are harder to remediate and govern, so this count should trend toward zero as ownership practices improve. Drill into Unowned Services to see a list of unowned services, including a severity breakdown of open findings and links to the repository and workspace.
At risk services
The At Risk Services table lists services carrying KEV or critical vulnerability findings, mapped to their owners. Use it to do the following:
- Identify concentration of risk — Whether a small set of services persistently reappear on this list (signaling unresolved technical debt) or rotate out over time (signaling active remediation).
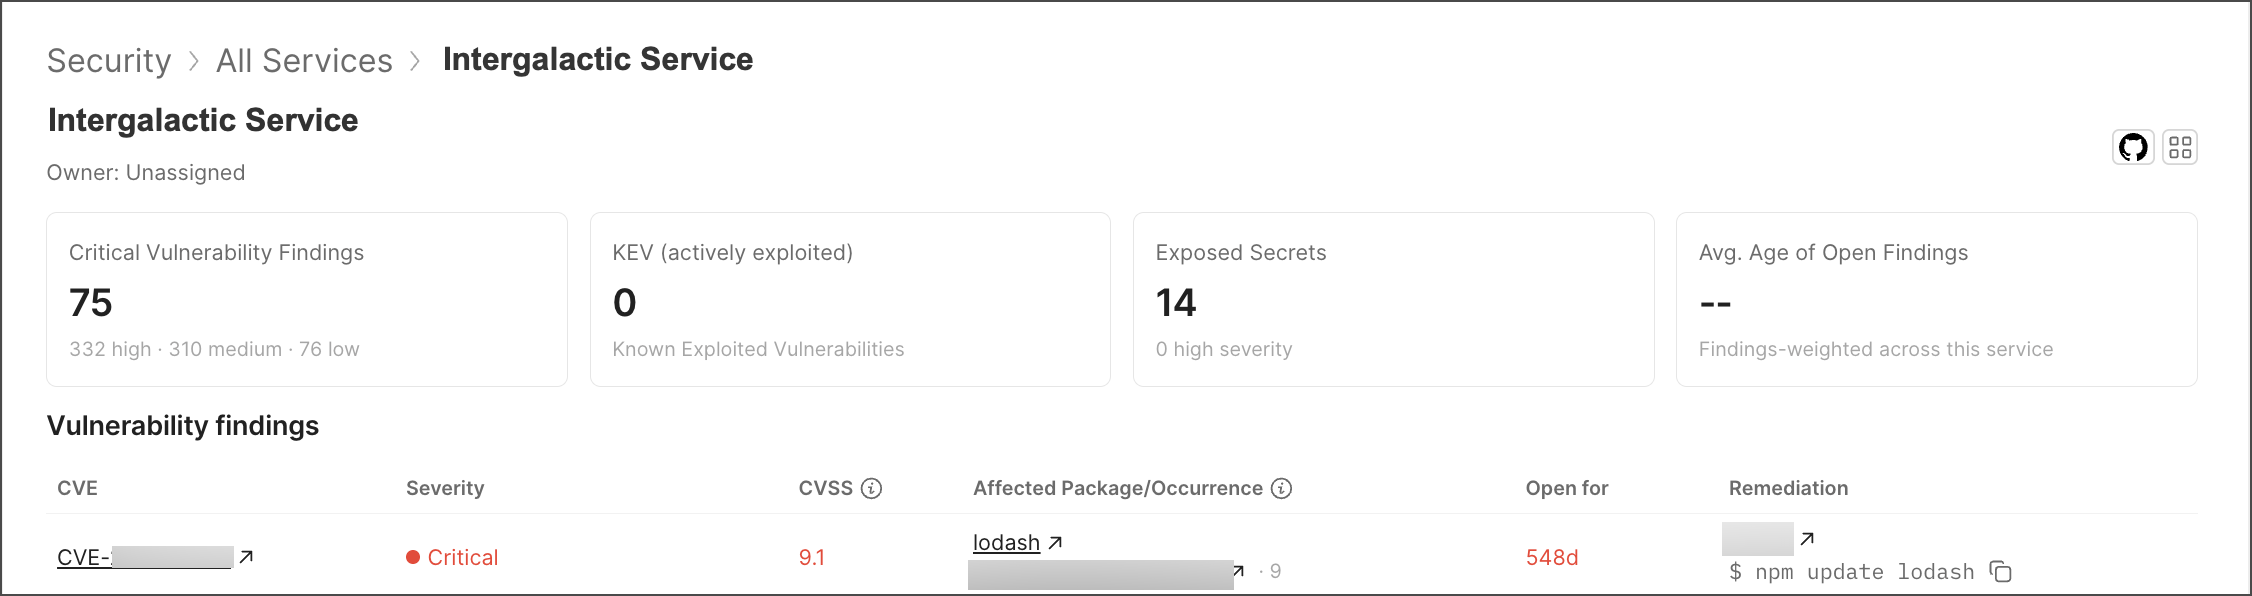
- Drill into a service’s security profile by selecting its row, including its secrets count, KEV status, and severity-tiered vulnerability breakdown.
- Filter by owner or search by service name to focus on a specific team’s risk surface.
- Navigate directly to the associated repo and workspace for remediation.