
Visualize data in Postman Flows
The Display block accepts information from other blocks and creates a visualization of that information. You can select from several visualization types.
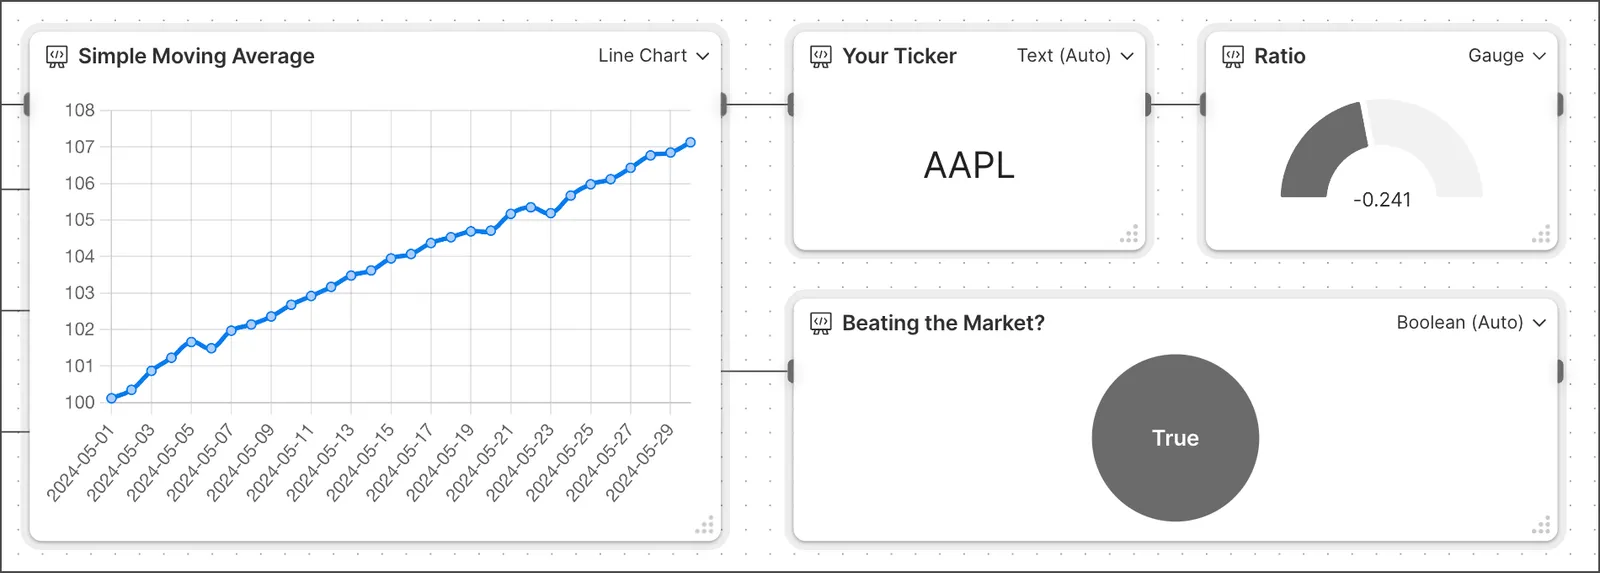
This image shows four types of output visualization types: line chart, text, gauge, and Boolean. You can find links to example flows for other visualization types in the Visualization types section.
Visualization types
The Display block supports the following types of output:
Text
When a Display block receives a string, it automatically selects the Text visualization type and shows the text.
To create an example text Display block, do the following:
-
Create an HTTP Request block with a GET request to
postman-echo.com/get. -
Create and connect a Select block to the HTTP Request block and enter
body.headers.host. This selects a string from the response. -
Create a Display > Text block, then connect the Select block to the Display block.
To adjust the text size, select the Display block, then click
 Additional Settings > Text size.
 -
Click Run in the Flows toolbar. The Display block displays the
postman-echo.comstring from thebody.headers.hostresponse.
Boolean
When a Display block receives a message that’s either true or false, it automatically selects the Boolean visualization type, displaying True or False.
To create an example Boolean Display block, do the following:
- Create an HTTP Request block with a GET request to
postman-echo.com/get. - Create and connect an Evaluate > FQL block to the HTTP Request block and enter the
value1.http.status = 200FQL query. This query checks if the response returns a200status code. - Create and connect a Display > Boolean block to the Evaluate block’s Result port and run the flow. If the response has a
200status code, the Display block shows a circle that says True. If not, the circle shows False.
Line chart
The Line Chart visualization type accepts two lists and plots them on X and Y axes in a chart. The first list received is the X axis, and the second list is the Y axis.
To create an example line chart Display block, do the following:
- In the Start block, click
 Add input. Enter “List 1” for the first input, then add another input and enter “List 2”. Change both inputs to
  List.
List. - In the right sidebar, select
 Scenarios > Create scenario.
 - Enter
[10, 20, 30, 40, 50, 60, 70]for List 1’s data and[100, 200, 300, 400]for List 2’s data. Click Save.
Save. - Create a Display > Line Chart block, then connect the List 1 and List 2 inputs in the Start block to the Display block.
- Click Run in the Flows toolbar. A line chart displays the data on their respective axes.
Gauge
The Gauge visualization type shows a value’s position in a range using a half-pie chart.
To create an example gauge Display block, do the following:
-
Create an HTTP Request block with a GET request to
techcrunch.com/wp-json/wp/v2/posts. -
Create and connect an Evaluate > FQL block to the HTTP Request block.
-
In the Evaluate block, enter the
$count(value1.body)FQL query to count how many items the response body contains. -
Create a Display > Gauge block.
-
Connect the Display block to the Evaluate block’s Result port, then click Run. The gauge shows the number of items in the response body as the shaded part of the graph.
To set the minimum and maximum values for the gauge, click
Additional Settings in the Display block.