About the API Catalog
This feature is available on Postman Enterprise plans. For more information, see the pricing page.
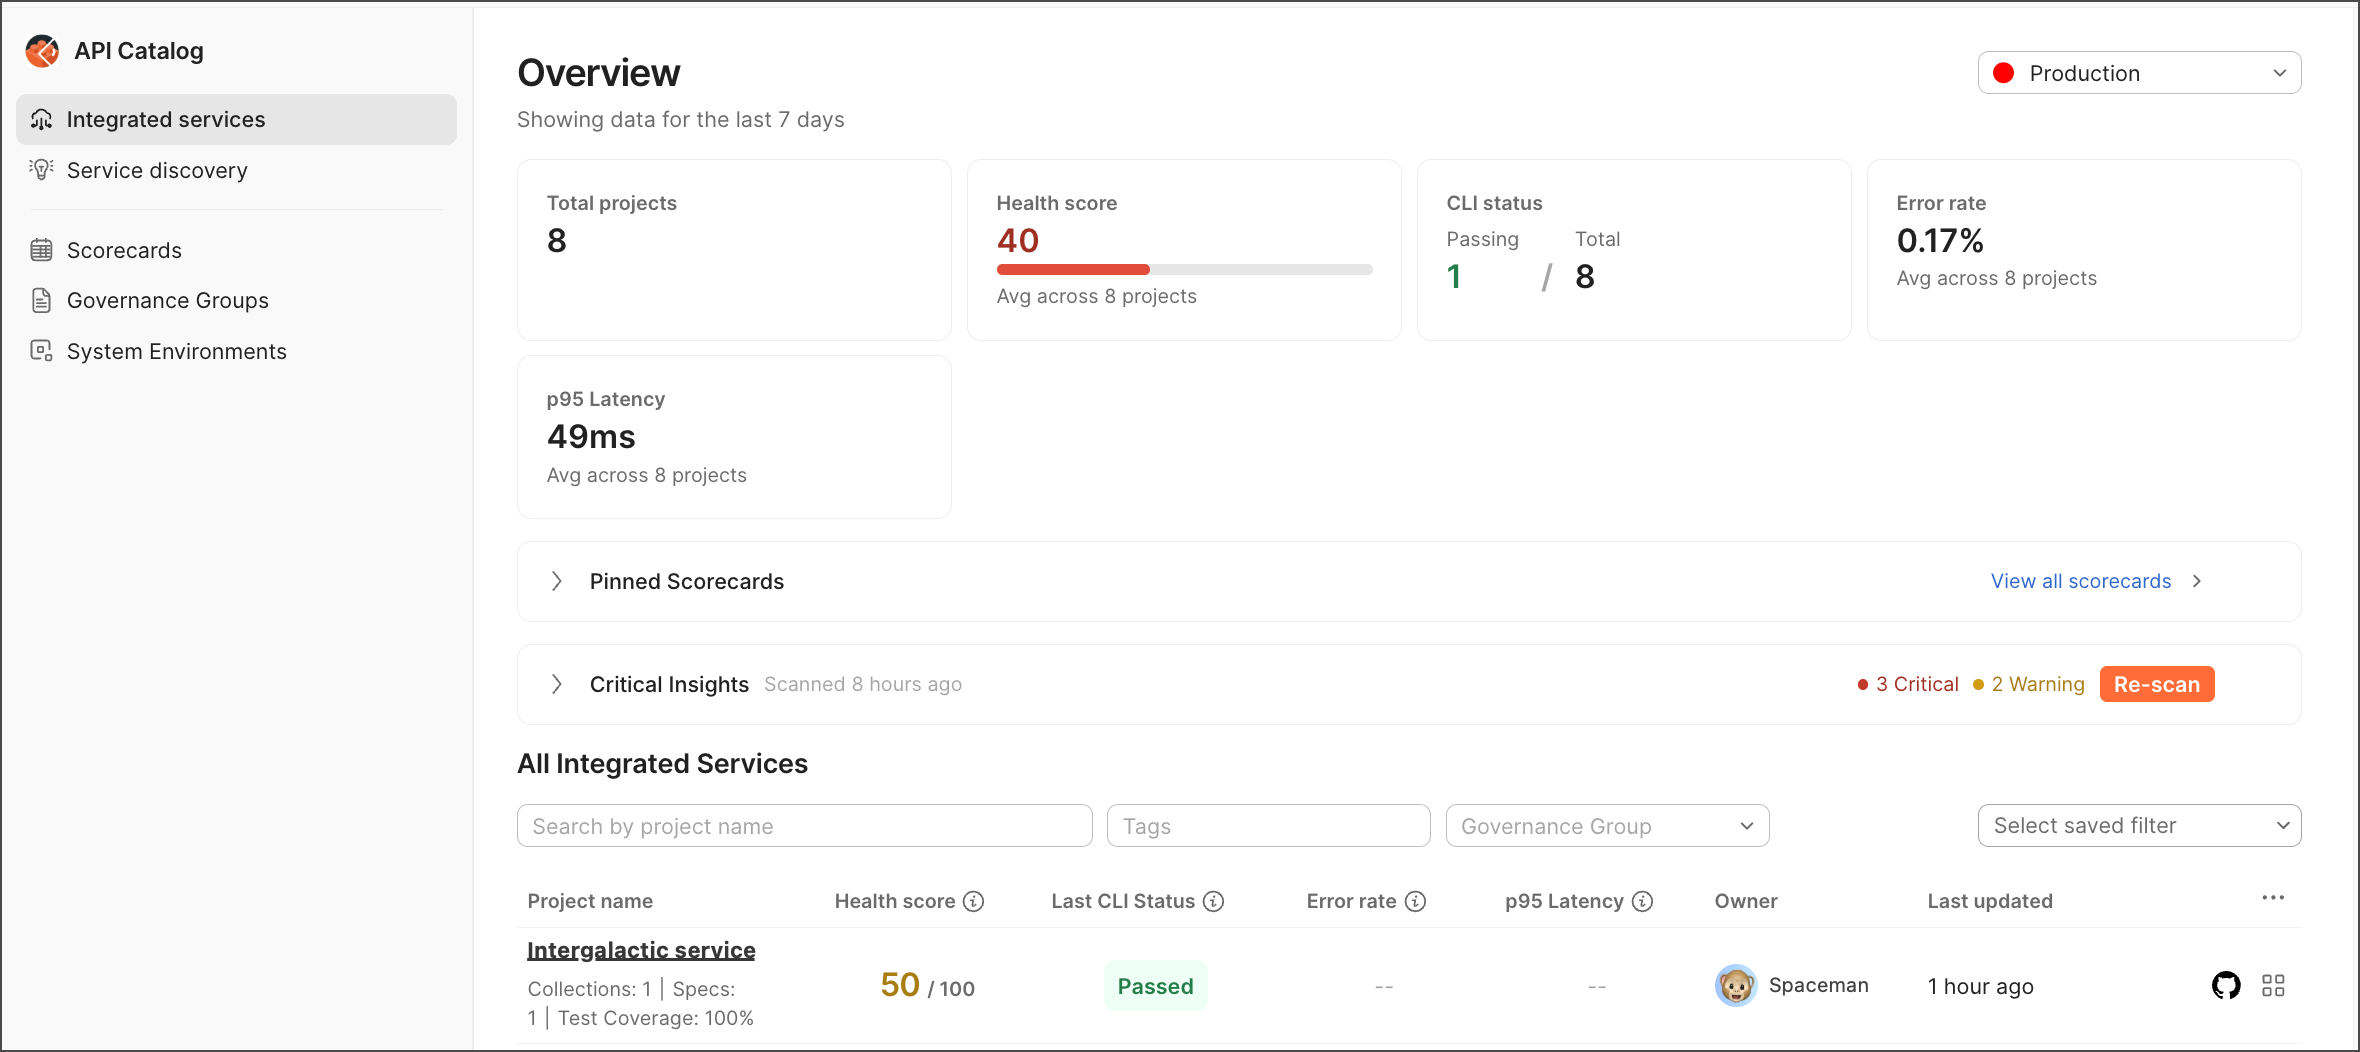
The API Catalog is a centralized dashboard for monitoring, analyzing, and governing APIs across your organization. It aggregates runtime analytics from Postman CLI runs, CI/CD pipelines, and spec linting results into actionable insights. The API Catalog works with Agent Mode, so you can ask questions about your APIs and get help with fixes when something is broken.
To access the API Catalog, from ![]() Home, click API Catalog.
Home, click API Catalog.
Prerequisites
- You need the Admin role to get the data flowing into the API Catalog from different third-party cloud connectors and Git repositories.
- To configure the API Catalog for your organization, pin and unpin scorecards, and create custom scorecards, you need to be an API Catalog Manager. As an API Catalog Manager, you can view all connected workspaces. Learn more about Postman roles and permissions.
As a developer, you can only view the workspaces you have access to.
What’s inside
The API Catalog consists of these main components:
- Catalog list
- Scorecards
- Governance groups
- System environments
Catalog list
The API Catalog shows all of your discovered services. You can filter and sort your API list in different ways. Use tags to mark which APIs you want to manage. The catalog shows who owns each API. You can also see how APIs are connected to each other and check health metrics. The API Catalog also shows you which APIs aren’t properly managed with Postman Insights (if you have access).
You can do the following:
- Make views with your filters and tags.
- Show different information at once.
- Jump to the views you need.
Create and manage scorecards to measure API quality across different metrics.
Scorecards give you a quick way to see how your APIs are doing and find areas for improvement. You can pin important scorecards to the top of your API Catalog Overview for easy access.
Click Create Scorecard to set up a new scorecard. You can choose from a variety of metrics, for example, runtime health, test quality, and spec quality. Set thresholds for each metric to determine when an API is healthy, needs attention, or is critical.
Once you create a scorecard, you can apply it to any API in your catalog to see how that API scores based on the defined metrics and thresholds.
Governance groups
Governance groups help you make and enforce rules for your API specifications like OpenAPI. You can have different rules for different types of APIs, for example, one set of rules for public APIs and another for internal APIs.
As a result of setting up governance groups and rules, your team can do the following:
- Developers using Postman can see these rules in the Postman app.
- The Postman CLI can pull these rules and enforce them in the CI pipeline.
- You can configure the Postman CLI to block releases or trigger warnings.
- Rules help score how well your APIs follow your own standards.
To learn more, see Define and enforce API standards with governance groups in Postman.
System environments
System environments are your actual setups like production, staging, or beta. Setting these up helps Postman track your APIs correctly.
When you run tests on multiple APIs, for example, system environments help group the results so you can see how each API performs.
Discover APIs and services
The API Catalog automatically shows all of your connected Postman workspaces. To populate the catalog, connect your Postman workspace to your source code. Postman then discovers APIs in that repository and adds them to the catalog. You can connect your Postman workspace to your source code in different ways, for example, through cloud connectors or code discovery. For more information, see Connect API Catalog to your services.
View the project
A project displays all the data Postman knows about that API across development, test, and production.
Customize your view
Click ![]() View more actions in the list header to customize which columns appear in your view. Then, click the Select saved filters dropdown to save your view for easy access later. You can also switch between different environments (for example, staging or production) using the environment selector.
View more actions in the list header to customize which columns appear in your view. Then, click the Select saved filters dropdown to save your view for easy access later. You can also switch between different environments (for example, staging or production) using the environment selector.
Individual projects provide the following information about your APIs:
-
Workspace analytics — View performance metrics, error rates, and activity across workspaces.
-
Endpoint health monitoring — Track p95 latency, error rates (4xx/5xx), and request volumes per endpoint.
-
CI/CD integration — Monitor GitHub Actions, GitLab CI, Jenkins pipeline runs with PR-level insights.
-
Spec linting — Aggregate OpenAPI specification quality scores and violation tracking.
-
System environments — Classify and filter data by canonical environments (prod, staging, beta).
-
 chat — Ask Postman AI questions about your APIs and get help with fixes when something is broken.
To learn more, see Explore your services.