API response structure in Postman
The Postman response viewer helps you visualize and check the correctness of API responses. An API response consists of the response body, headers, cookies, and the HTTP status code. You can view details about the response, including test results, network information, response size, and response time. You can also save responses as examples or files.
Response body
The Postman Body tab gives you several tools to help you understand the response, including a data type selector, preview, search, filter, and AI-powered visualization.
Data type selector
When you send a request, Postman automatically displays the data type of your response. For example, JSON responses are automatically shown in the JSON mode. Syntax is highlighted depending on the data type. You can select from the following types:
- JSON
- XML
- HTML
- YAML
- JavaScript
- Markdown
- Raw
- Hex
- Base64
If your response contains a link, it’s highlighted. Clicking it loads a GET request.
Force JSON formatting. You can choose to have Postman auto-select your response data type or force JSON formatting. To update your selection, go to ![]() Settings in the Postman header, select App settings. Under General > Request > Response format detection, select JSON.
Settings in the Postman header, select App settings. Under General > Request > Response format detection, select JSON.
Preview
The ![]() Preview tab provides a friendlier view into the data that’s being sent and helps you understand any errors that occur. It supports many file formats, including audio, video, script, image, plain, and embed. JSON and XML data types display as tables.
Preview tab provides a friendlier view into the data that’s being sent and helps you understand any errors that occur. It supports many file formats, including audio, video, script, image, plain, and embed. JSON and XML data types display as tables.
Search
You can use search phrases to find content of interest in your response. Click ![]() Search in the response pane. You can also place your cursor in the response and press ⌘+F or Ctrl+F.
Search in the response pane. You can also place your cursor in the response and press ⌘+F or Ctrl+F.
Filter
To improve readability, you can filter your responses to show only relevant information. Use JSONPath to filter JSON responses. Use XPath to filter XML and HTML responses.
With JSON, XML, or HTML selected in the data type selector, click ![]() Filter in the response pane. Then enter a JSONPath expression to filter JSON or an XPath expression to filter XML or HTML. For JSONPath expressions, Postman suggests autocomplete options based on keys in the response. The response automatically displays the results of your expression.
Filter in the response pane. Then enter a JSONPath expression to filter JSON or an XPath expression to filter XML or HTML. For JSONPath expressions, Postman suggests autocomplete options based on keys in the response. The response automatically displays the results of your expression.
If you enter an expression that doesn’t return results, Postman flags it with a yellow underline. If you enter an expression that isn’t valid, Postman will flag it with a red underline. Hover over the expression to view a tooltip about the issue.
The expression persists in the response unless you close the request or clear the expression. A green dot on ![]() indicates that the response is being filtered with an expression. Click
indicates that the response is being filtered with an expression. Click ![]() to clear the expression and display the full response.
to clear the expression and display the full response.
When you enter an XPath expression, you can use it with both the XML and HTML data types.
Visualization
The ![]() Visualize tab renders the data in the API response according to visualization code that you add to the Scripts > Post-response tab. You can also use Agent Mode to generate visualizations for you. For details on how to add, use, and debug visualization code, see Visualize request responses using Postman Visualizer.
Visualize tab renders the data in the API response according to visualization code that you add to the Scripts > Post-response tab. You can also use Agent Mode to generate visualizations for you. For details on how to add, use, and debug visualization code, see Visualize request responses using Postman Visualizer.
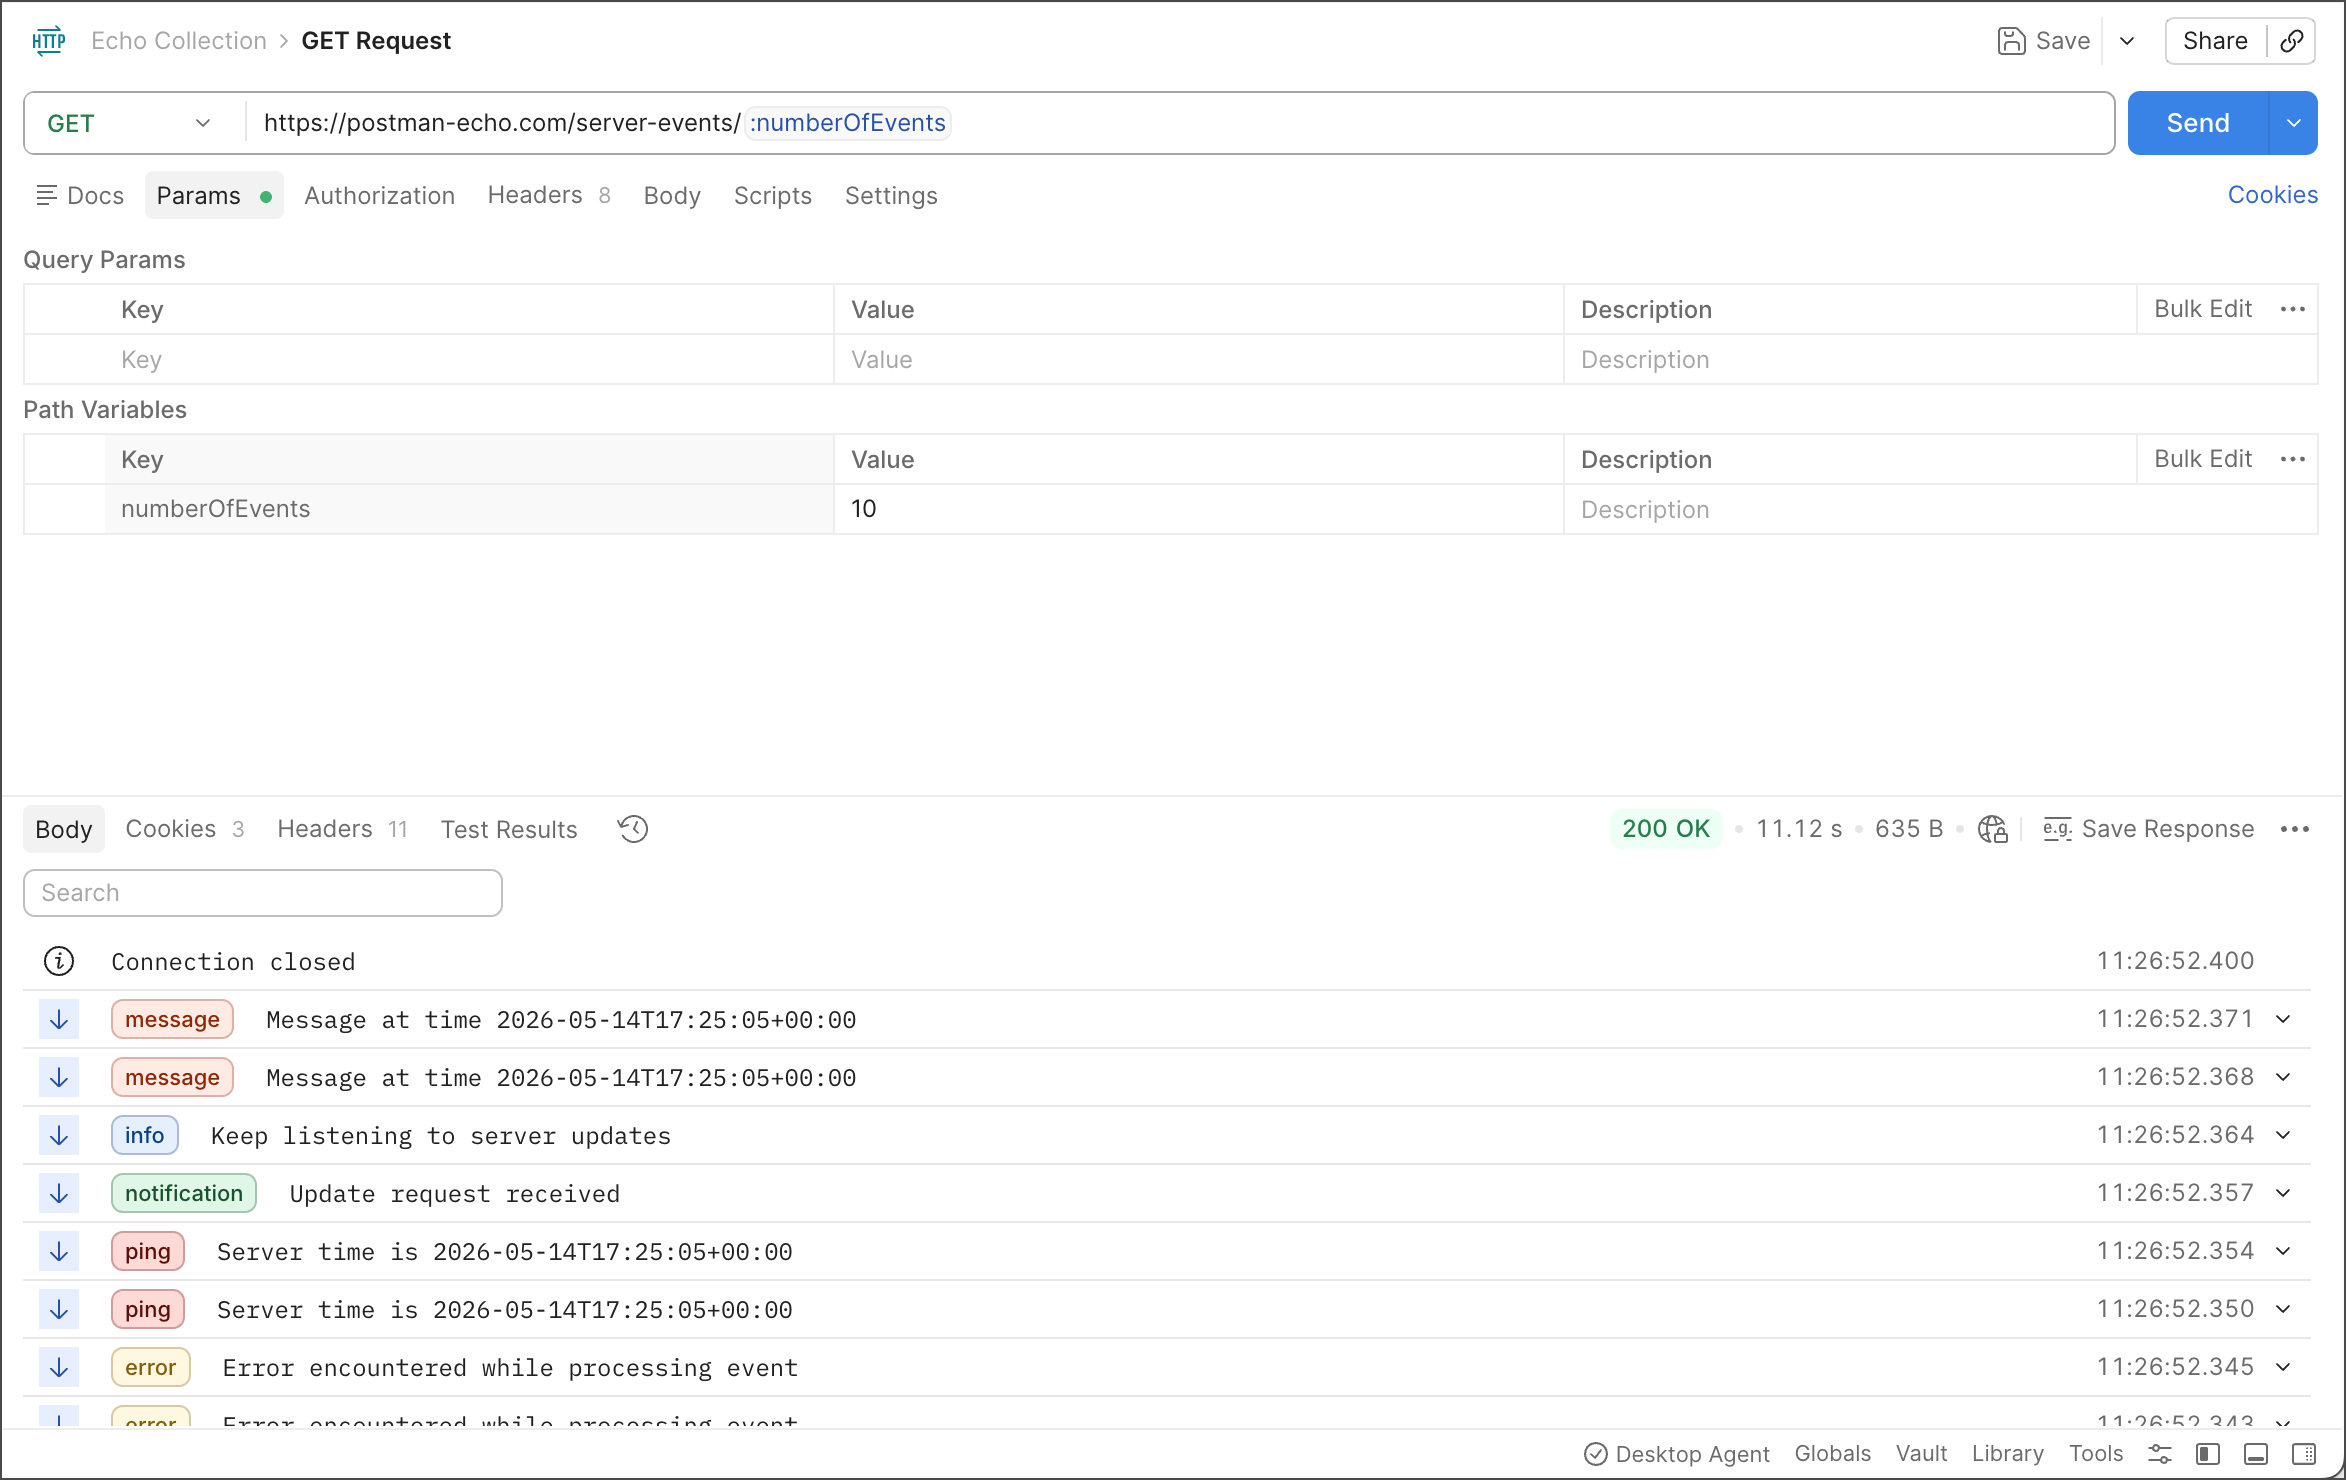
Server-sent events
Server-sent events (SSE) is a standard server-push technology for real-time communication between a client and a server over HTTP/S. SSE supports efficient and low-latency data transmission, making it a popular choice for applications that require real-time updates, such as chat apps and live sports updates.
You can test, debug, and document your SSE-based APIs along with your other APIs in Postman.
Consume server-sent events by creating a new HTTP request. Postman establishes the SSE connection and then streams and displays the events. You can drill into, search through, and clear the SSE messages in the response section. You can also save the response.
To try SSE communication, use the following Postman Echo service endpoint:
Cookies
You can select Cookies to inspect cookies sent by the server. A cookie’s entry includes its name, value, the associated domain and path, and other information about the cookie.
To learn more about working with cookies in Postman, see Create and capture cookies using Postman’s cookie manager.
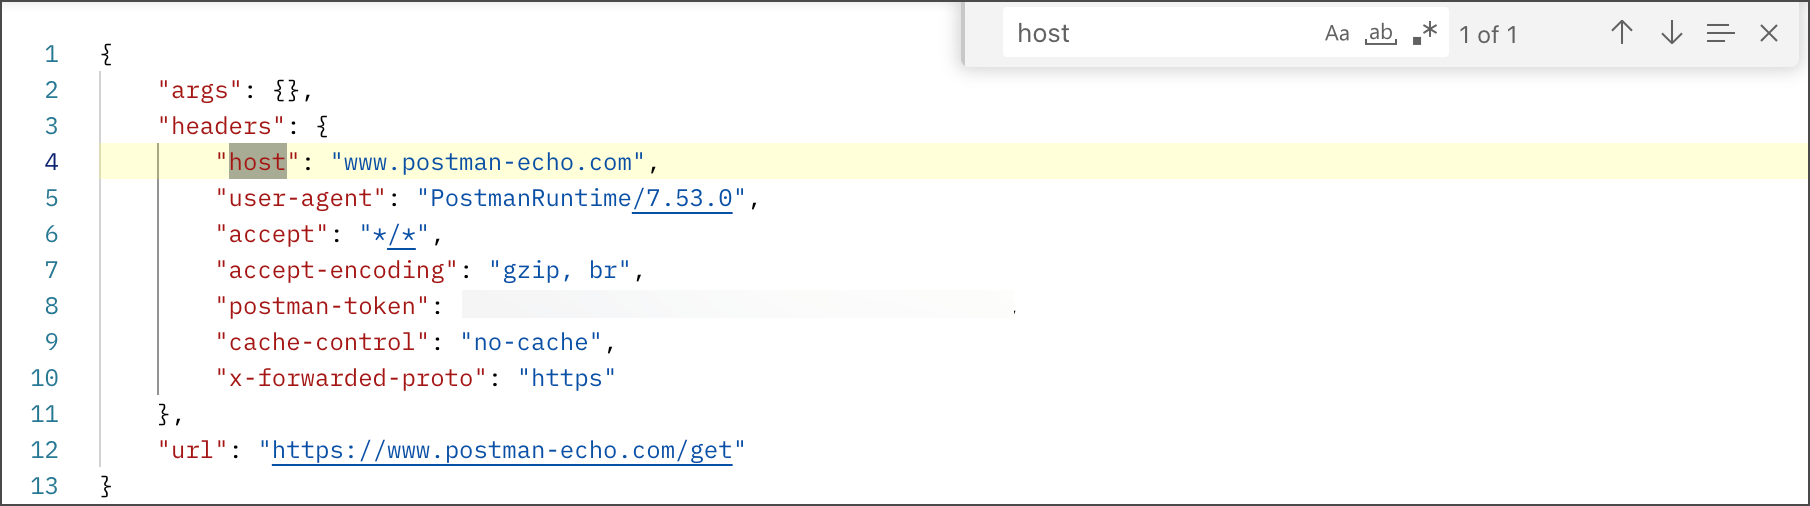
Headers
Headers are displayed as key-value pairs under the Headers tab. Hover over the information icon ![]() next to the header name to get a description of the header according to the HTTP specification.
next to the header name to get a description of the header according to the HTTP specification.
Test results
If the API request you are viewing had any tests, the results are displayed in the Test Results tab.
To learn more about running tests against API requests in Postman, see Write scripts to test API response data in Postman.
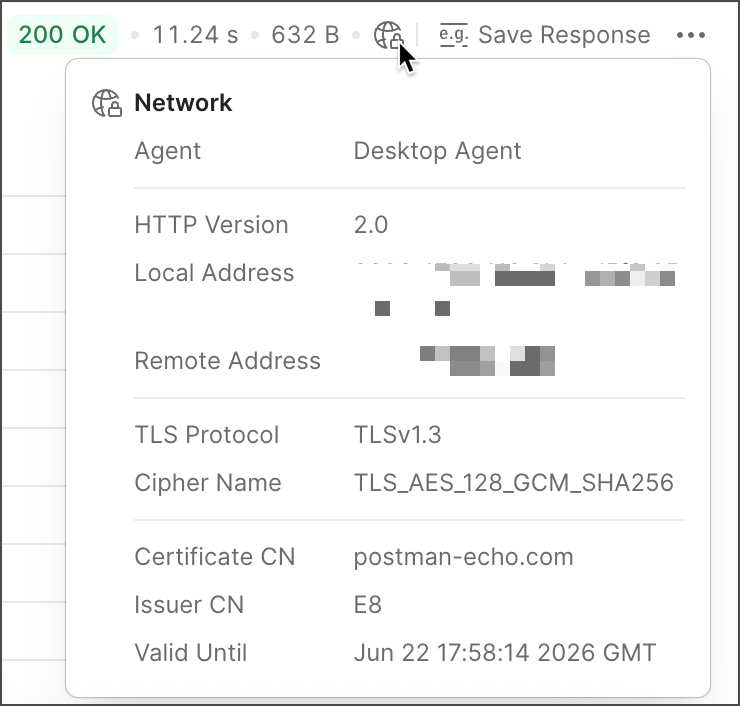
Network information
Postman displays network information when your API returns a response. Hover over the network icon ![]() to get the local and remote IP addresses for the request you sent.
to get the local and remote IP addresses for the request you sent.
When you make an https request, the network icon includes a padlock. When you hover over the icon, the network information shows more information including the HTTP version and certificate verification details.
SSL verification errors
If SSL verification is enabled and verification fails, the response area displays an error message. Select the link to open the Console and view more information about the error.
If needed, you can turn off SSL verification for the request or turn it off globally in Postman:
- To turn off SSL verification for a request, click Disable SSL verification in the response error message.
- To turn off SSL verification globally, click
 Settings > App settings in the header and under General > Request turn off SSL certificate verification.
If you have SSL verification turned off and your request returns a certificate verification error, you can hover over the network information for details about the error.
For requests that are successful and return data but with a certificate verification failure, the Console displays a warning.
Response code
Postman displays the response code returned by the API. Hover over the response code to get a short description of the code and what it means.
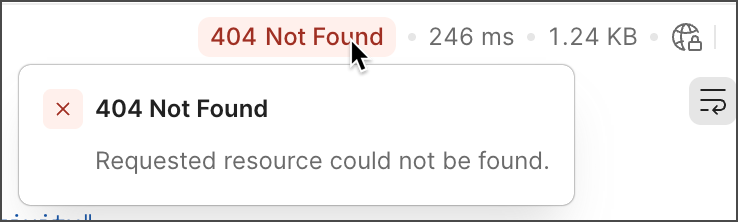
Some API responses also contain custom messages that can help you understand response codes. For example, if you receive a 401 Unauthorized response, the message might tell you to check the token you used in the request. If custom messages are returned, they’re displayed in the Body of the response.
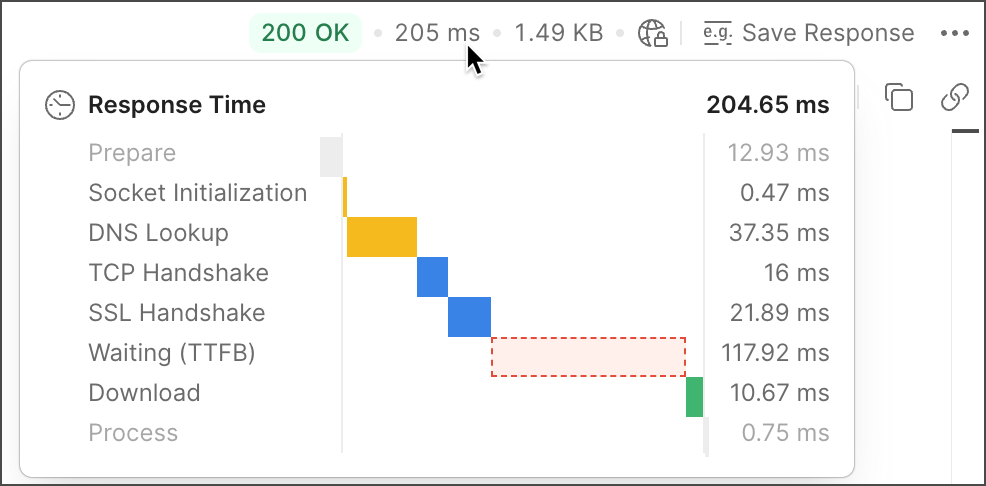
Response time
Postman automatically calculates the time in milliseconds it took for the response to arrive from the server. This information can be useful for some preliminary performance testing. Hover over the response time for a graph with information on how long each event in the process took.
Response size
Postman displays the size of the response. Hover over the response size to get a breakdown by body and header sizes.
Saving responses
If a request has been saved in a collection, you can save responses for that request. Once the response has been returned, you can:
- Click
 Save Response to save the response as an example that you can access later.
 - Select
 View more actions > Save response to file to save the response as a JSON file.
 - Select View more actions > Clear response to remove any data in the response viewer. Note that for event-based requests, this is available after the stream is closed.